Integrating HyperDX with Vue.js using OpenTelemetry

The HyperDX browser SDK allows you to instrument your Vue.js application to send events to HyperDX using the open standard and widely accepted Opentelemetry. This allows you to view network requests and exceptions alongside backend events in a single timeline.
Additionally, it'll automatically capture and correlate session replay data, so you can visually step through and debug what a user was seeing while using your application.
Let’s get started.
Requirements
- A Vue.js application you wish to instrument
- An account on HyperDX (opens in a new tab)
Installation
First we’ll need to install the HyperDX npm module in our application.
To install the HyperDX npm module, open your terminal and navigate to your Vue.js project directory. Then, run the following command:
npm install @hyperdx/browserThis will add the necessary dependencies to your project. Once the installation is complete, we can move on to configuring HyperDX in your Vue.js application.
If you’re using Typescript your main.ts file will look something like this:
import './assets/main.css'

import { createApp } from 'vue'
import { createPinia } from 'pinia'

import App from './App.vue'
import router from './router'

const app = createApp(App)

app.use(createPinia())
app.use(router)

app.mount('#app')
Because this is the entrypoint into our Vue application, this is where we’ll want to initialize the HyperDX collector.
To do this, we'll need to import and initialize the HyperDX SDK at the top of our main.ts file. Here's how we can modify our code to include HyperDX:
import './assets/main.css'
import { createApp } from 'vue'
import HyperDX from '@hyperdx/browser';

import { createPinia } from 'pinia'
import App from './App.vue'
import router from './router'


HyperDX.init({
  apiKey: 'YOUR_HYPERDX_API_KEY',
  service: 'my-vue-app',
  tracePropagationTargets: [/api.myapp.domain/i], // Set to link traces from frontend to backend requests
  consoleCapture: true, // Capture console logs (default false)
  advancedNetworkCapture: true, // Capture full HTTP request/response headers and bodies (default false)
});

const app = createApp(App)

app.use(createPinia())
app.use(router)

app.mount('#app')
Make sure to replace 'YOUR_HYPERDX_API_KEY' with your actual HyperDX API key, and 'my-vue-app' with a name that identifies your service. This setup will initialize HyperDX and start collecting telemetry data from the moment your Vue application starts.
Let’s open up our Vue app in development and see the traces and logs:
npm run devand open our browser to http://localhost:5173/ (opens in a new tab). In a few seconds you should see your log statement show up in the HyperDX logs.
Production and Development
While logging errors from your front-end application is a great practice, things like “advancedNetworkCapture” may be a bit too verbose for most development need especially in production.
Vue gives us a special flag that’s called NODE_ENV (Vue actually injects this, as it’s not typically found in the browsers environment) to let us know when we are running in production.
If you wanted to enable some of the more advanced, but verbose features of HyperDX, it would be advisable to enable these only in development.
import './assets/main.css'
import { createApp } from 'vue'
import HyperDX from '@hyperdx/browser';

import { createPinia } from 'pinia'
import App from './App.vue'
import router from './router'


HyperDX.init({
  apiKey: 'YOUR_HYPERDX_API_KEY',
  service: 'my-vue-app',
  consoleCapture: NODE_ENV === "production" ? true : false, // Capture console logs (default false)
  advancedNetworkCapture: NODE_ENV === "production" ? true: false, // Capture full HTTP request/response headers and bodies (default false)
});

const app = createApp(App)

app.use(createPinia())
app.use(router)

app.mount('#app')
Now we’ve limited our ingestion of logs to just error captured by HyperDX while in production mode.
Error capturing with HyperDX and Vue.js
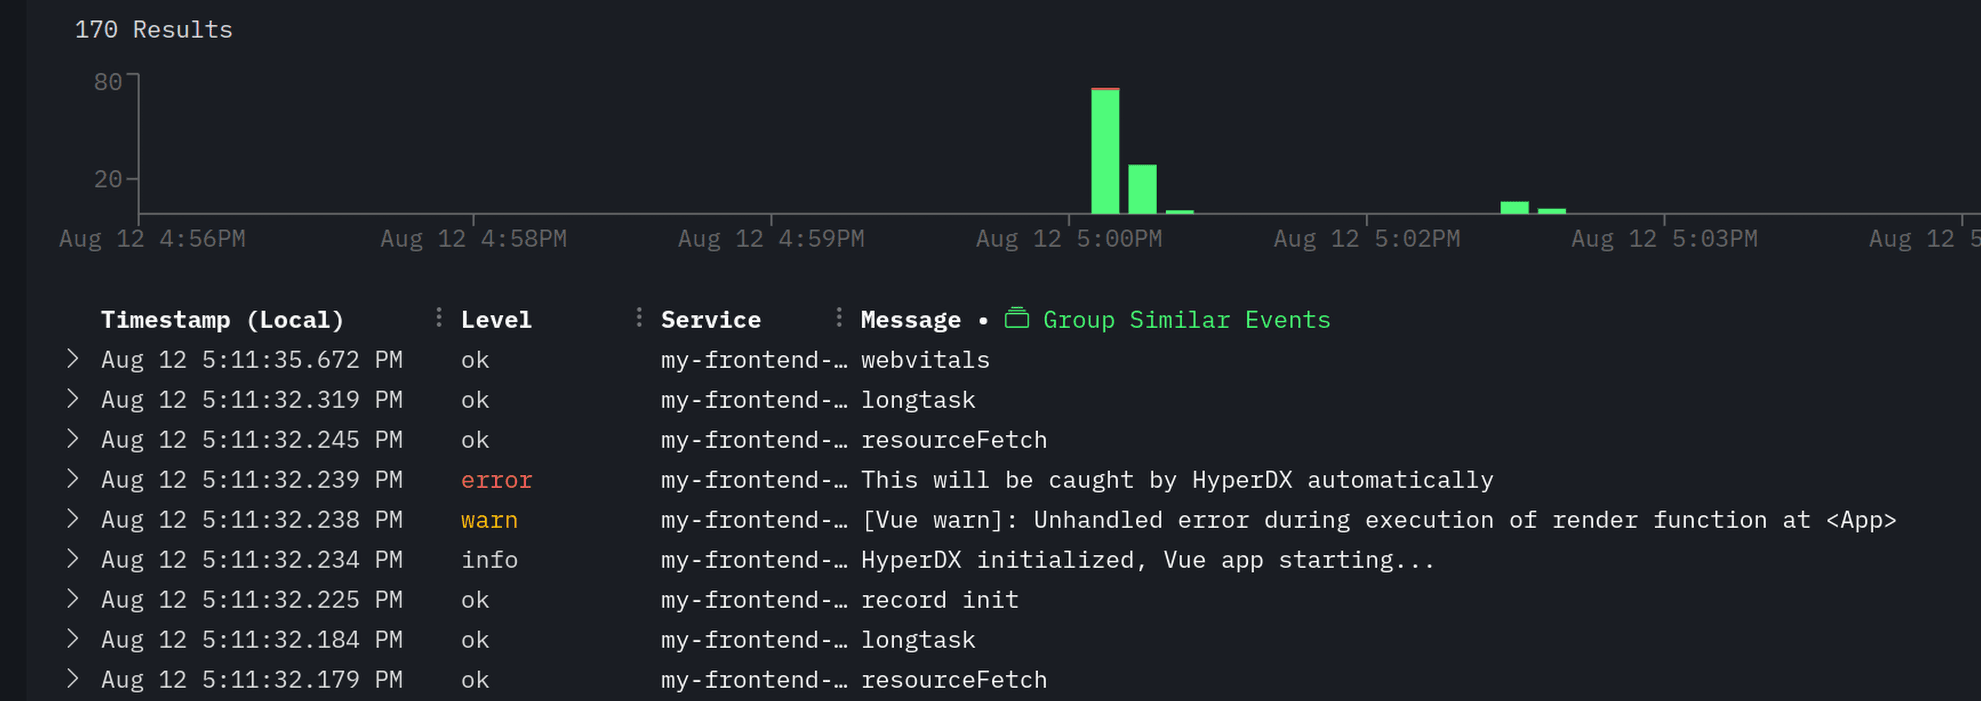
Speaking of errors, lets create and error just to see it work in realtime. There’s no configuration here needed, just initializing HyperDX has already enabled error capture.
I’m going to change my App.tsx to look something like this:
// App.tsx

<script setup lang="ts">
import { RouterLink, RouterView } from 'vue-router'
import HelloWorld from './components/HelloWorld.vue'
const throwError = () => {
  throw new Error('This will be caught by HyperDX automatically')
}
</script>

<template>
  <header>
    <img alt="Vue logo" class="logo" src="@/assets/logo.svg" width="125" height="125" />

    <div class="wrapper">
      <HelloWorld msg="You did it!" />
      {{ throwError() }}

      <nav>
        <RouterLink to="/">Home</RouterLink>
        <RouterLink to="/about">About</RouterLink>
      </nav>
    </div>
  </header>

  <RouterView />
</template>
In this example, we've defined a component that intentionally throws an error when it's mounted. This will cause an error to be generated as soon as the component is added to the DOM.
When you run your application with this code, you should see an empty page and something that looks like the following in your HyperDX dashboard.

Summary
OpenTelemetry isn’t just for capturing server logs, traces and metrics. It's a powerful tool for capturing and analyzing frontend performance and user interactions as well. By integrating HyperDX with your Vue.js application, you gain valuable insights into your application's behavior, performance, and any issues that may arise. This comprehensive approach to monitoring allows you to provide a better user experience and quickly identify and resolve problems in your frontend code.
If you're interested in monitoring your Vue.js application with HyperDX, sign up for a free account (opens in a new tab) and start capturing frontend events, errors, and network requests today.