Getting Started
HyperDX is a cloud-based production monitoring & debugging tool that allows you to correlate logs, metrics, traces, and user sessions all in one place.
You can debug complex errors and user issues all in one platform, without needing to jump between multiple tools and correlate using timestamps and manual correlation ids.

You can instrument your application using vendor-neutral OpenTelemetry (opens in a new tab) for logs and traces and then search or visualize your telemetry within HyperDX.
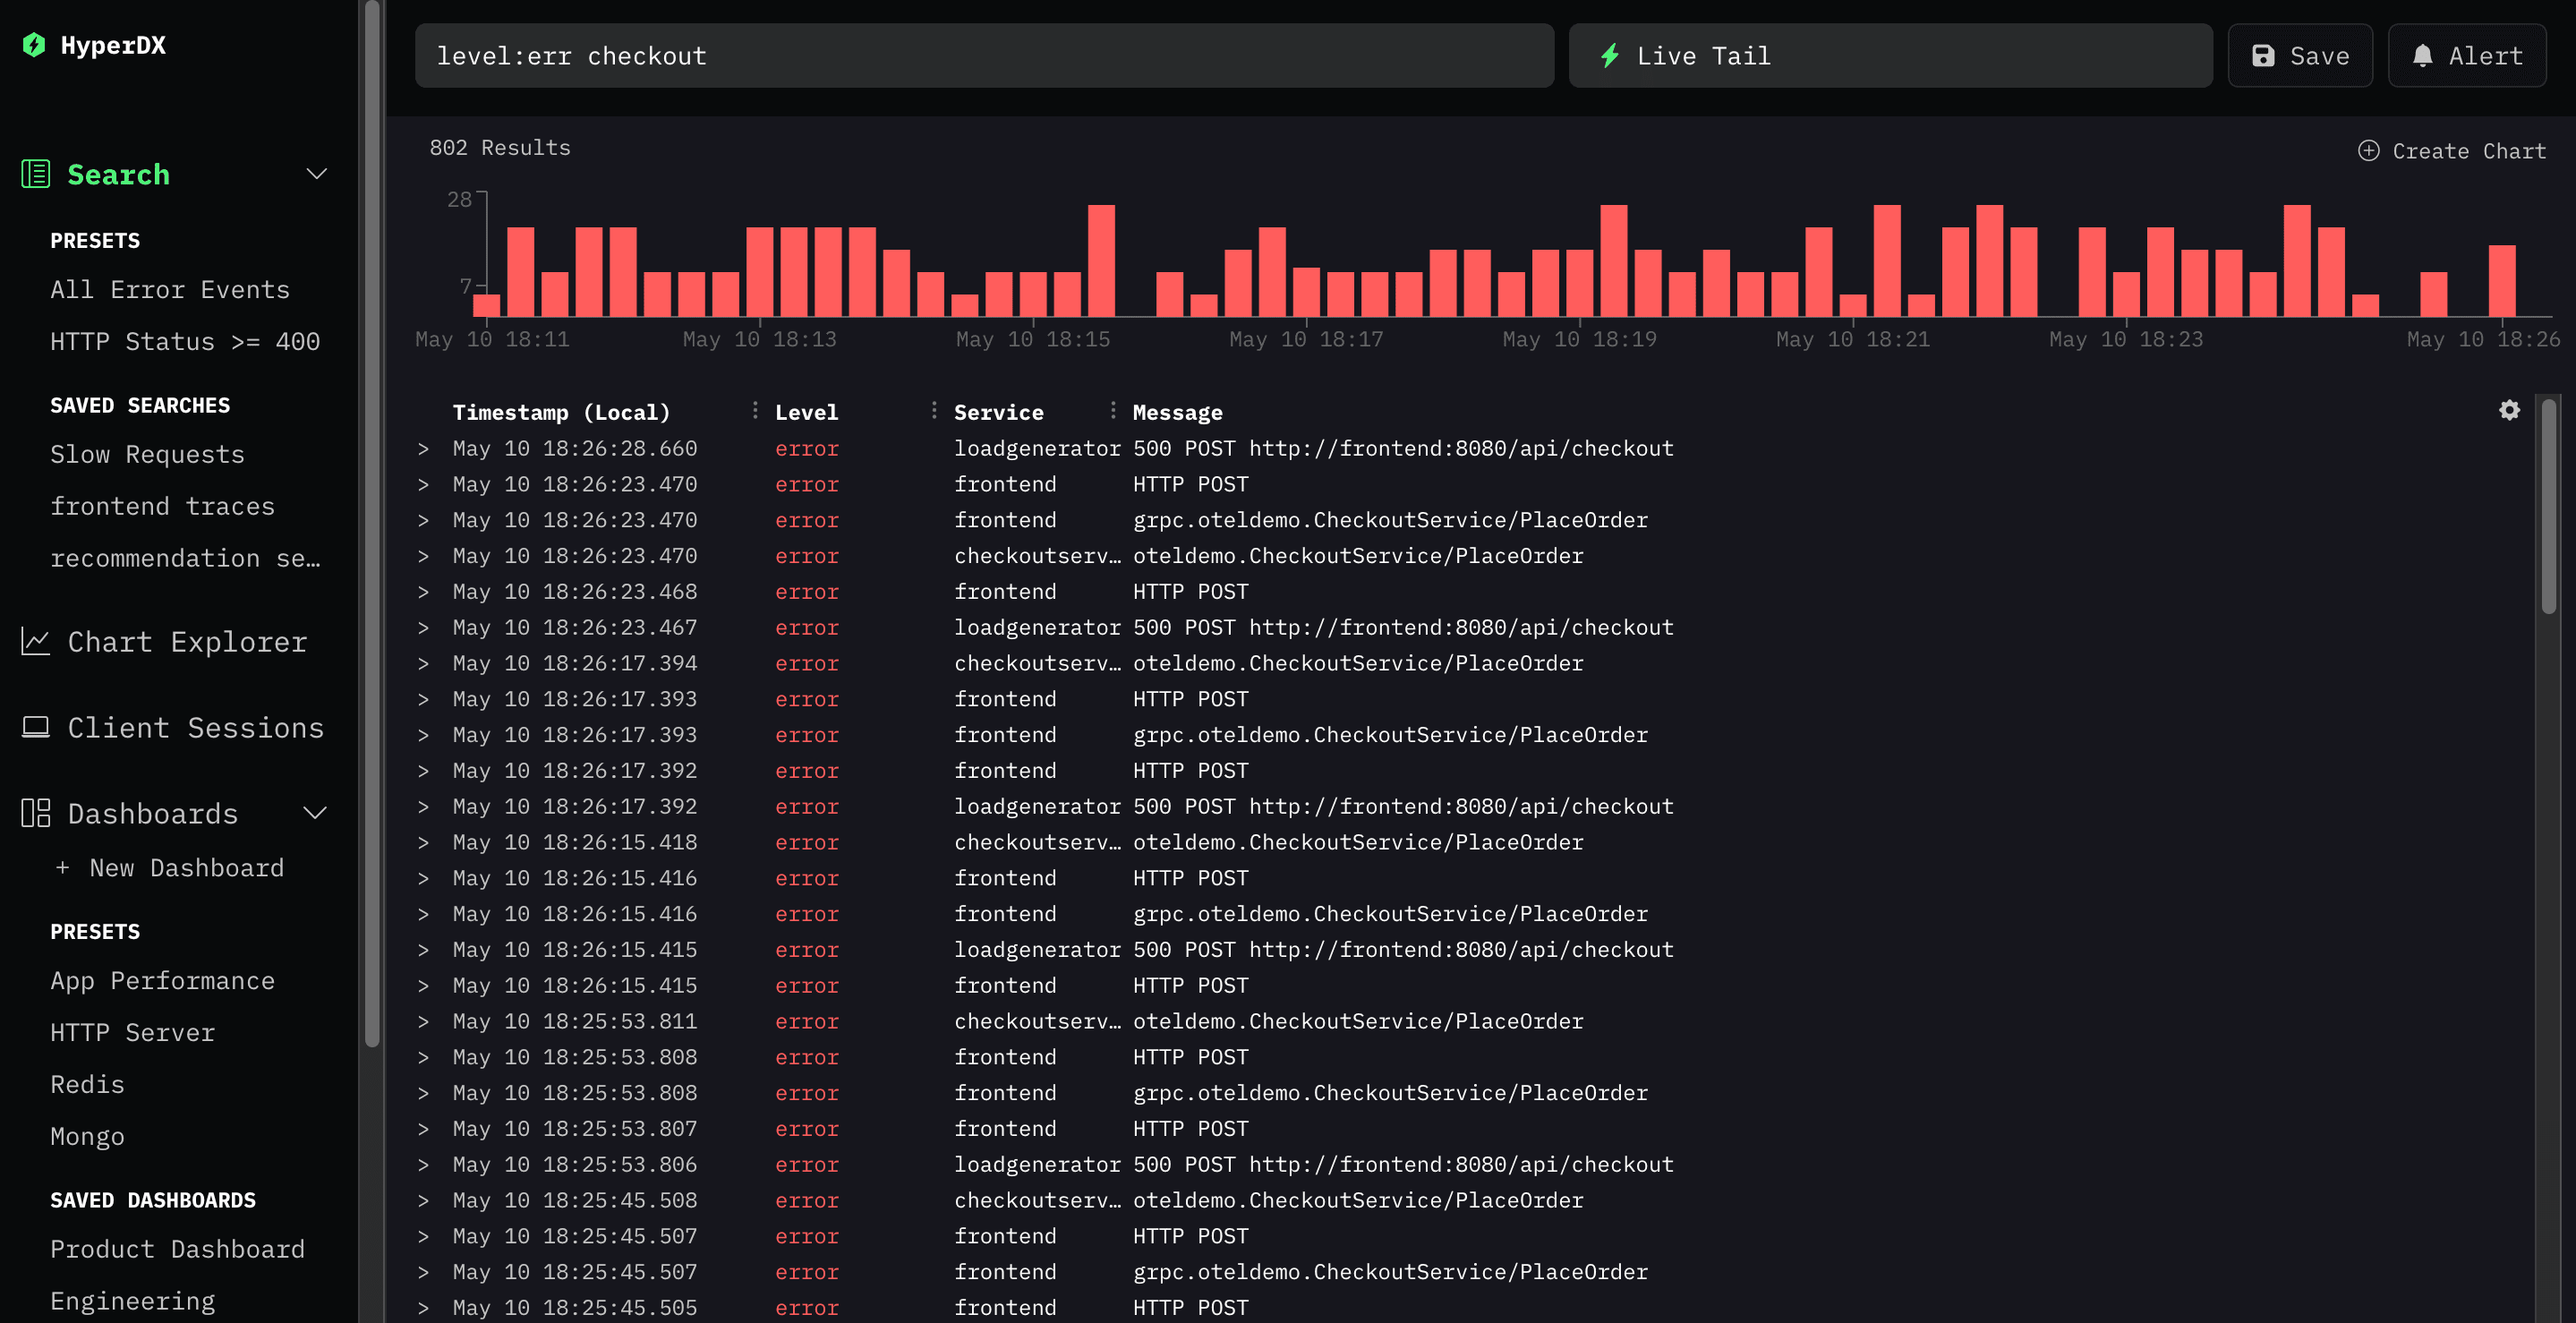
HyperDX allows you to do full-text search across all your events without any complex search syntax, and allows you to create alerts and visualizations on top of all your events as well.
Install
You can get started by following one of the installation guides below:
Languages/Frameworks
Platforms
Data Collectors
Or alternatively, you can use an OpenTelemetry SDK or collector and configure HyperDX as a destination.
