Introducing Log Patterns - Automatically Cluster and View Log Trends
When you’re dealing with an incident or investigating a suspicious spike in logs, it’s often an incredibly tedious task to sift through millions of log messages. Even if you’re able to identify a suspicious log message, it’s often hard to tell if it’s a novel log message that just started to be emitted during the incident, or if it’s a log message that’s always been emitted by the system.
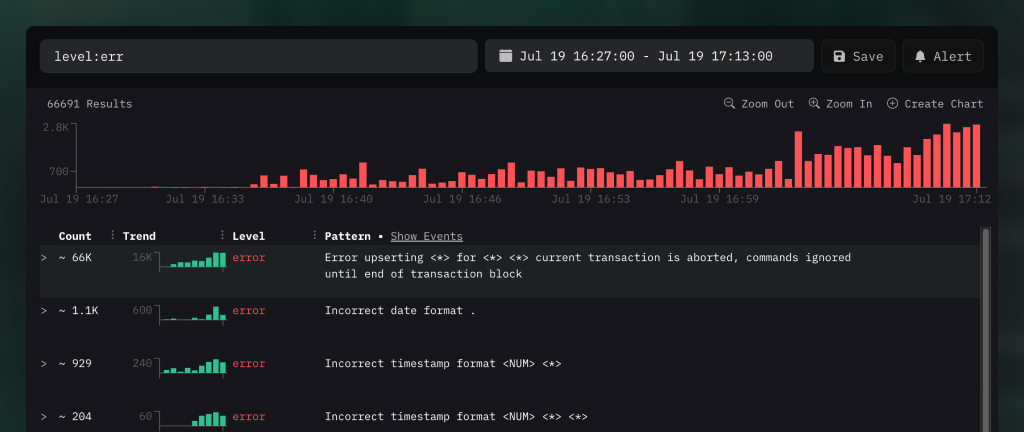
This is why we’re introducing log patterns into HyperDX. From any search query, you can click into the log pattern view to get an automatic summary of matching search results clustered by their similarity in log message in less than a second. Instead of needing to manually sift through millions of log events and trying to keep track of log patterns yourself, you can instead just go through a handful of different log patterns detected by HyperDX and check which ones are the most relevant to your problem.
Automatic Log Patterns
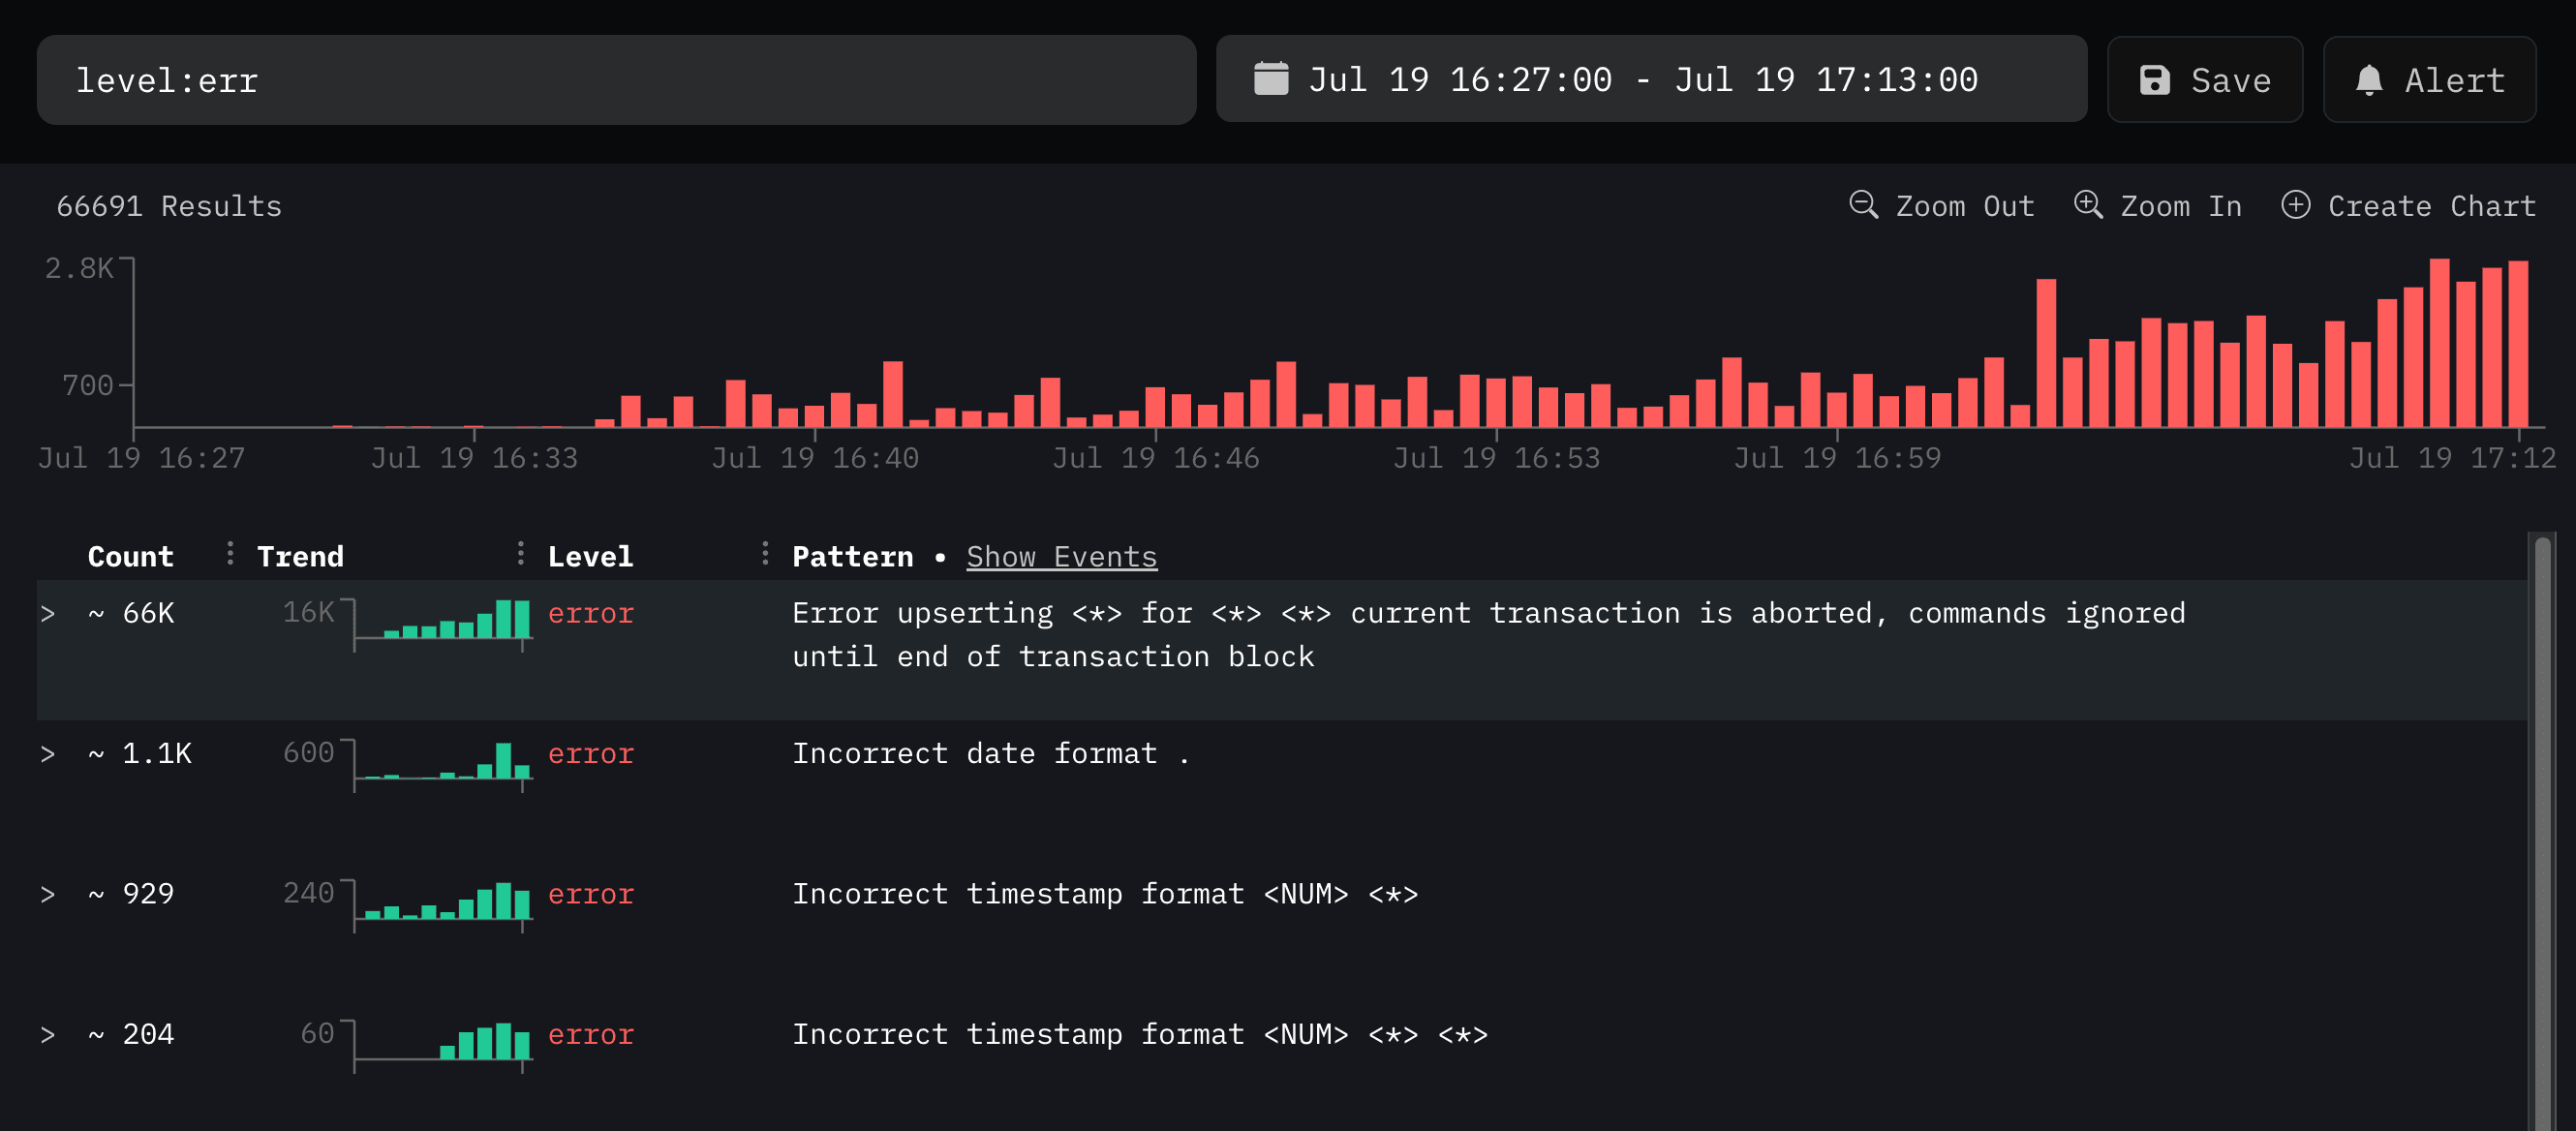
In this example, you can see how thousands of application-specific error
messages were grouped together into a single log pattern, even though each
individual error message was referencing a different unique ID (substituted with
<*> in the UI)
The log patterns are computed dynamically based on your log events, so they don't have to adhere to any specific log format and can adapt to your specific team or service's log patterns without any manual tuning or defining regular expression patterns.
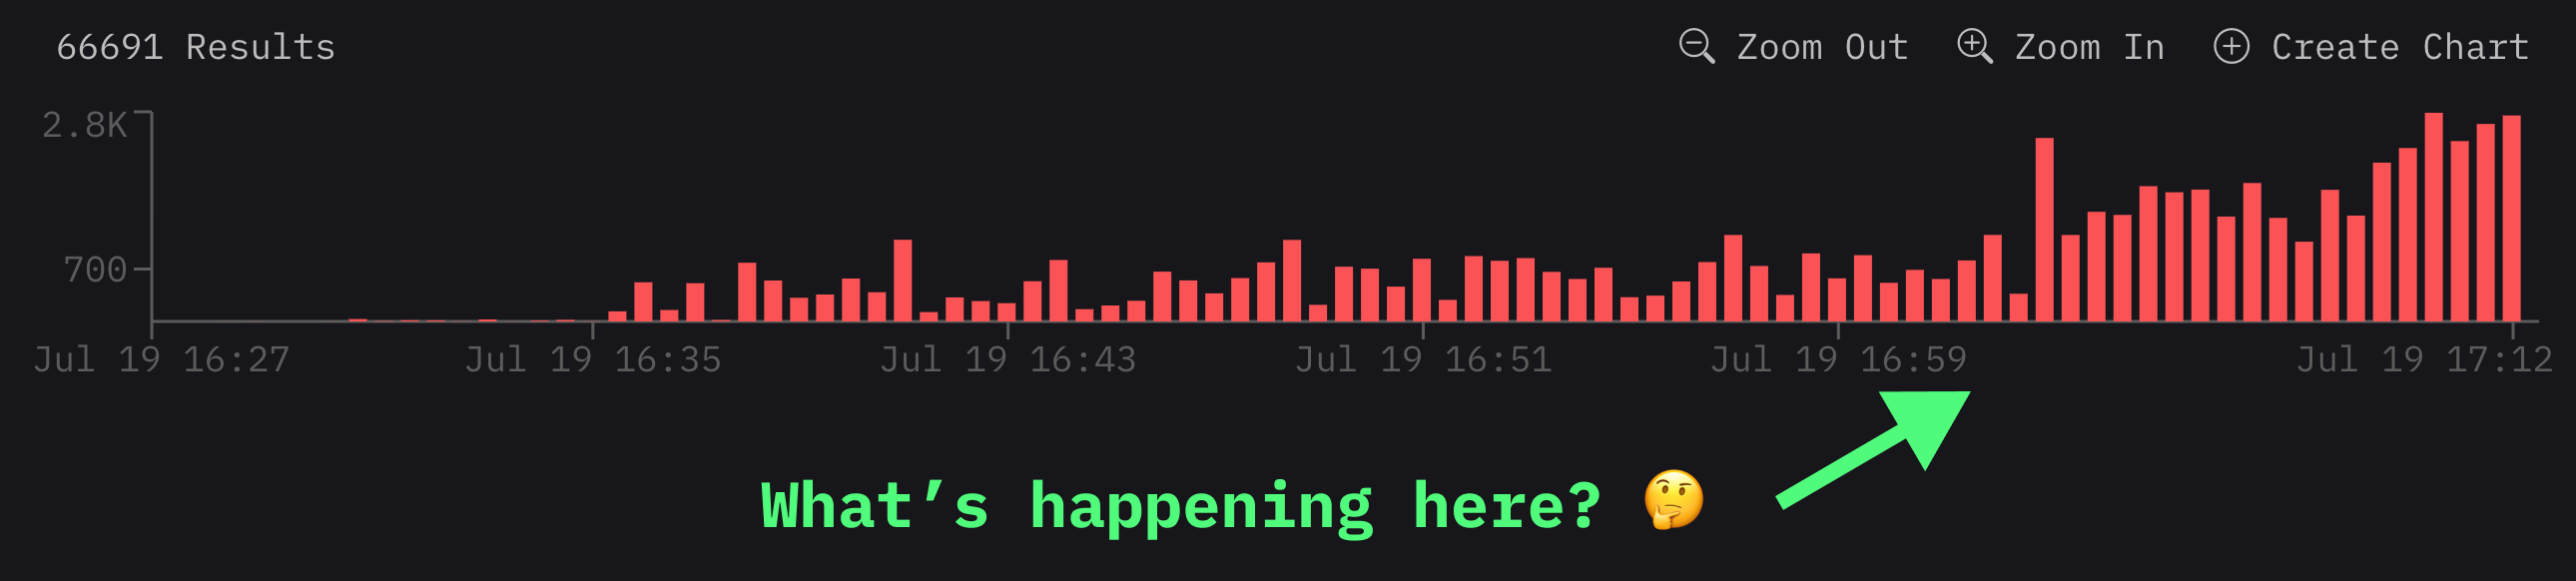
Along with each log pattern, you can also inspect the trend of that log pattern over time, so you can check if that log pattern has always existed within your system, or if it’s a novel log that just started to be emitted during the incident. This can help rule out noisy logs or unrelated error messages. It's also much easier to see which log clusters are driving a spike in error logs by looking at their aggregate trend, as opposed to trying to establish trends of logs manually.
Inspecting Relevant Log Patterns
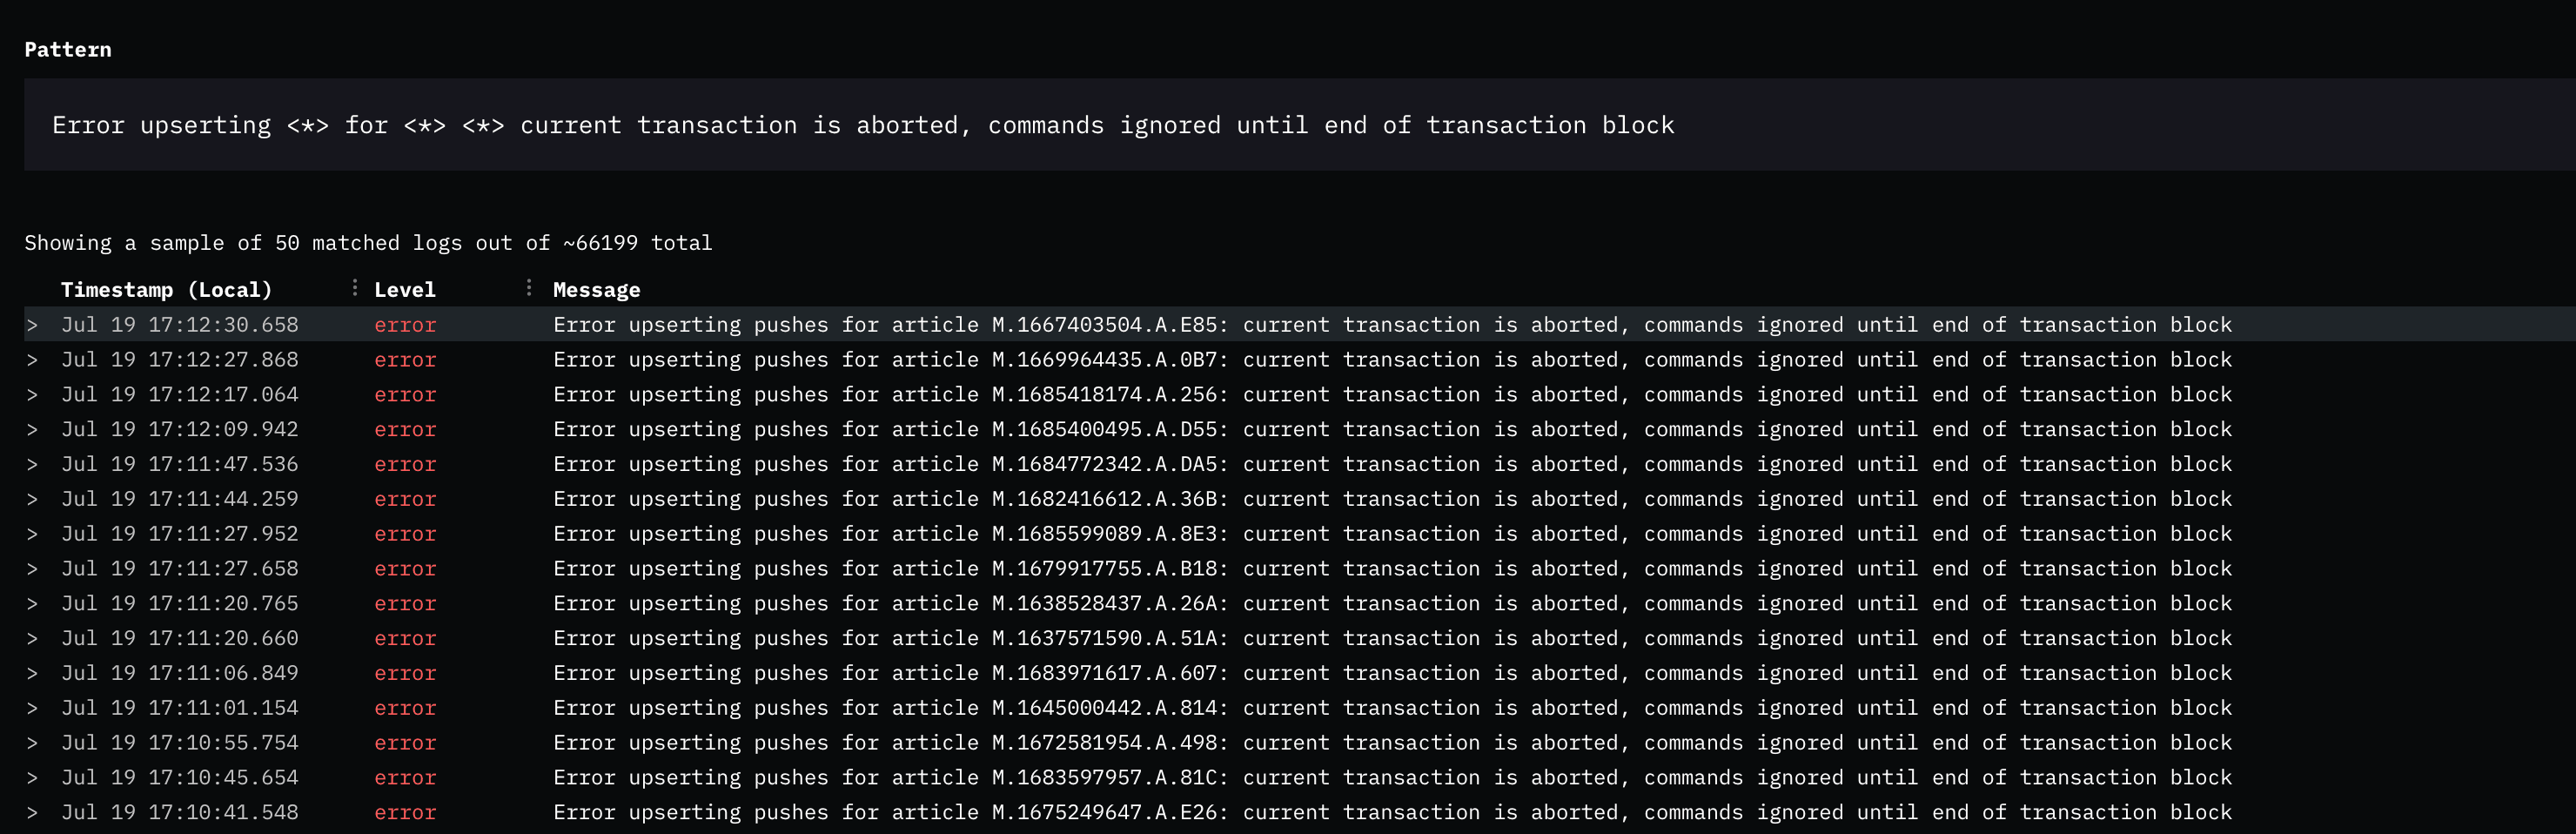
Once you’ve identified a suspicious result, you can dive into a specific log pattern to view specific examples of log messages that match that pattern. Each individual log event can be further expanded to view the entire log detail, and any trace and session replay information related to that log message if they're available.
Beyond an Incident
Beyond helping with incidents, log patterns can also help improve visibility into log volume, where you can easily leverage the high-level overview of log patterns to identify noisy log sources or debug messages that you can turn off to save cost and avoid clutter in your search results. Additionally, they can help give an overview of different types of logs a specific service can emit, so you can easily discover whether a specific log message already exists for an event you're trying to track or graph.
Get Started
Log patterns are available to all HyperDX users including those on the free tier and is accessible directly by clicking "Show Log Patterns" in the search page. Not using HyperDX yet? Sign up for a 14 day free trial to see how log patterns can help speed up your debugging and incident response workflows.