Node.js Logging Best Practices
Logging done right can completely change how you work with Node.js applications. Imagine having a tool that always tells you how your application is performing, whether there are any errors, what users are doing, and almost anything else you might want to know about the application.
Logging makes this information comprehensible and easy to follow. While it might sound too good to be true, that’s the purpose of logging.
Today, we’ll cover tips on improving your logging, making the debugging process easier, and offering options for effective logging.
Why Logging is Important
Before diving in, let's explore why logging should be a priority in your development process.
Improved Developer and User Experience
Logging drastically improves developer experience (DX) by reducing time spent debugging.
Developers can spend hours debugging. The problem gets even worse when it comes to multiple environments, such as production, staging, and development. Having logs in place makes searching for information on most critical application activities increasingly easier. Debugging sessions go from hours to minutes because developers can clearly see what happened in an application before the bug occurred.
User experience (UX) becomes smoother by reducing the number of errors.
Errors create friction between your application and the end user. The more friction, the less pleasant the UX is. Even a single error can cause user frustration and cause them to leave your app. Logs can help detect errors your users are running into faster so we can resolve them faster and reduce friction, resulting in happier users.
Measuring your Impact
Measuring the stability of your application is critical in both targeting how to improve application stability and can demonstrate the level of impact made from stability fixes in your application. Logging can help by providing quantifiable data on your application’s performance and errors.
For example, by analyzing logs you can track key metrics such as the number of errors occurring over a time period (ex. The number of errors over the past 6 months) and see if they’re increase or decreasing. If for example, you can show that errors have gone down from a few hundred a day to a few a day, you can clearly communicate the improvement to the rest of your team.
Beyond simply counting errors, logs can even help categorize and prioritize errors based on impact, for instance being able to segment errors based on whether they impact a critical system or whether it was a minor issue. This categorization can help present a even more detailed and actionable picture, highlighting not just the reduction in errors, but also if they were occurring in critical parts of the application
Compliance with Regulations
Certain regulations make it mandatory to create and preserve logs for a period of time. Here are examples of such regulatory requirements:
- GDPR (General Data Protection Regulation) applies to all of Europe. You’re required to follow (opens in a new tab) GDPR if you collect and process any kind of personal data. The regulation requires (opens in a new tab) storing the data of processing activities.
- CCPA (California Consumer Privacy Act). According to the act (opens in a new tab), if you collect a user’s personal information, you must provide at least 12 months of logs that contain the user's personal information upon request.
- HIPAA (Health Insurance Portability and Accountability Act). The 45 C.F.R. § 164.312(b) requires medical providers in the United States to implement data security measures to protect patient's information. This includes maintaining logs to track Protected Health Information (PHI) access.
Logging Best Practices
Clear and Descriptive Log Messages
A clear log message gives a descriptive overview of an event that occurred in an application. Remember, you’re mostly writing log messages for other people to help them get insights into what has gone wrong in the system. Other people reading your logs might not have all the context you have, or they may even be non-technical users outside of the engineering team who need to read your logs (ex. Customer support).
A good log message follows the next rules:
- Concise: Get to the point quickly. Avoid unnecessary words or technical jargon that might confuse readers.
- Informative: Include relevant details like function names, variable values, or error codes.
- Actionable: Explain what action was taken or what event occurred.
- Human-readable: Use natural language and avoid cryptic abbreviations or codes.
Let’s look at a couple of examples of bad log messages:
Something went wrong with the database.(what exactly went wrong?)Received invalid input from the user.(what was the input? From which user?)ERR_CODE: 2F4ABA32(not readable for humans even with prior context)
Here's how those messages can be improved:
Database query failed: Timeout of 10000ms exceeded trying to connect to the 'products' table.User ‘ben-smith’ submitted an invalid email address in the registration form - 'ben#smith.'Page not found: User ‘ben-smith’ requested '/products/a323-13’, but the resource doesn’t exist.
Structure logging format
Logs pile up quite fast. Even with descriptive messages, a pile of logs is a huge amount of information that can be hard to scan through. That’s where structured logging plays a big role. A structured log is a way of organizing log messages in a particular and consistent way that is easy for machines (and humans) to parse.
Machine-readable logs make it possible to integrate with advanced analysis and observability tooling by declaring a specific log structure and format. There are different log formats, such as: JSON, key-value, CSV, etc., but JSON is the most popular and widely used format.
There is no strict format that you have to follow. It is important to decide what log structure best suits your needs and stick to it everywhere.
As an example of what this looks like in practice, as opposed to logging the following plain text log:
2023-12-04T15:30:00Z <INFO> User 'ben-smith' logged in successfully from 192.168.1.100You can create the following JSON structured log:
{
  "timestamp": "2023-12-04T15:30:00Z",
  "level": "INFO",
  "message": "User 'ben-smith' logged in successfully",
  "user": "ben-smith",
  "action": "login",
  "status": "successful",
  "ip_address": "192.168.1.100"
}
Notice that we created fields for the username, specific type of action, and status of this action. Such a structure makes it possible to do powerful analytics on this log message easily without complex and fragile regular expression parsing. For example you can build visualizations and monitoring based on: what percentage of login actions are successful, what percentage of the actions fail, and narrow down the analysis to a particular date or IP.
Use Appropriate Log levels
Log levels are like labels, they represent a log's importance and prioritize your log messages. Think of them as a quick way to categorize your logs, they let you understand what's going on at a quick glance.
Without log levels, it becomes hard to distinguish important messages from the pile of logs. Let’s say you have the following messages:
{ "message": "Database login successful for user api from 192.168.0.3, session will expire in 60 minutes" }
{ "message": "Database login successful for user automation from 10.0.0.9, session will expire in 60 minutes" }
{ "message": "Healthcheck completed" }
{ "message": "Database query failed: Timeout of 10000ms exceeded trying to connect to 'products' table" }
{ "message": "Database login successful for user ben-smith from 192.168.0.2, session will expire in 60 minutes" }
How would you quickly distinguish it among 10s and 100s of log messages? The answer is by using log levels. The same message using log levels would look like the following:
{ "level": "INFO", "message": "Database login successful for user api from 192.168.0.3, session will expire in 60 minutes" }
{ "level": "INFO", "message": "Database login successful for user automation from 10.0.0.9, session will expire in 60 minutes" }
{ "level": "INFO", "message": "Healthcheck completed" }
{ "level": "ERROR", "message": "Database query failed: Timeout of 10000ms exceeded trying to connect to 'products' table" }
{ "level": "INFO", "message": "Database login successful for user ben-smith from 192.168.0.2, session will expire in 60 minutes" }
Now, you don’t need to read all logs' messages. It is enough to find a
log with the ERROR level. The task gets even easier when using logging libraries
and observability services because they have a dedicated color for each log
level - errors are usually highlighted with red color.
At the start, it is enough to use only a couple of log levels. The most popular
ones are INFO for any information related to regular user activities and
ERROR for errors. Later, if needed, you can use other log levels like
WARNING, DEBUG, and TRACE for better granularity.
Be careful with the ERROR level. Usually, you want to use this only for
something critical that is actionable and you want to be aware of as soon as possible.
Think: would you want to be awaken at 2am if this happens?
Otherwise, it becomes just a noise that is easily ignored, and the whole value of this
level is lost.
One of the best practices regarding the ERROR log level is to set up alerts
for it. This increases your reaction time to any critical errors that occur in
your application.
Log Non-Error events
Logging error events is important, but it is not the only thing that should be logged. Audit logs are another major part of the logging strategy. Audit logs are records of user activities that occurred in the application. They convey information about user actions, resource access, system operations, and other non-error events.
Here are some examples of audit logs:
- Settings are modified
- External API calls
- User login and logout
- User creation and deletion
Why do you need them?
- Debugging: Audit logs can be used to debug issues that are not errors. For example, if a user reports that they can’t access a particular page, you can check the audit logs to see if the user has the necessary permissions or you can use the logs to help you build reproduction steps for a bug.
- Security: Audit logs are a great way to track user activities and detect any suspicious behavior. For example, if a user logs in from a different location, you can see it in the audit logs.
- Compliance: As covered earlier, some regulations require you to keep track of PII-related actions that occur in the system. Audit logs are a great way to comply with these regulations.
- Analytics: Audit logs can be used to analyze user behavior and improve the application. For example, you can see which features are used the most and which are not used at all.
Integrate Tracing IDs
When we think about logging, we often focus on final errors and exceptions. However, not all errors are direct results of a previous user action.
Consider the following example.

It is a straightforward case where the error message can convey most of the information you need to troubleshoot the problem.
But what about this one?

To effectively resolve the error, you must understand the chain of actions that led to the error. That’s why it is not enough to log only the final error that doesn’t provide additional information.
Wouldn’t it be nice to have something similar to a JavaScript error stack trace, where you see the whole path of the error? Integrating trace IDs can achieve the same result.
Trace ID is a unique identifier assigned to each event within a group of events. It allows you to see the whole chain of events and identify the actions that occurred before the actual error.
Take a look at how the same chain of operations would look like with trace
ID.
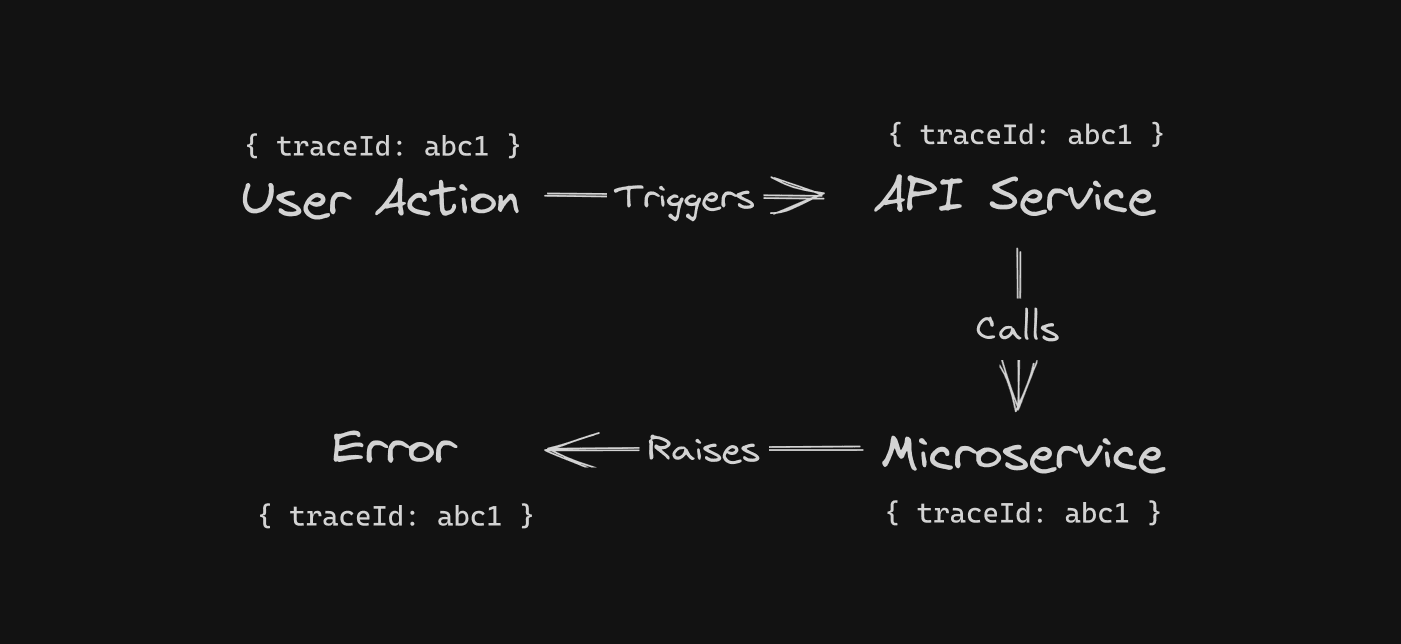
The trace ID in the resulting error allows you to query the whole chain that led to the error because every event in the chain has the same trace ID.
Within an application, you can implement trace ids using AsyncLocalStorage (opens in a new tab) or between services you can use an open source tool like OpenTelemetry (opens in a new tab) to automatically generate and propagate trace ids through an application and between services (even inbetween the browser and backend as well).
Avoid Logging Sensitive Information
Data can be leaked outside your application, and you’re not always in control of or aware of vulnerabilities. That’s why it is important to think in advance about what happens if logs are leaked. The last thing you want is to leak any sensitive information.
This includes anything that could be used to compromise security or privacy, such as:
- Personally Identifiable Information (PII): Full names, addresses, email addresses, phone numbers, social security numbers, etc.
- Financial Data: Credit card numbers, bank account details, transaction histories.
- Authentication Credentials: Passwords, API keys, security tokens, session IDs.
- Health Information: Medical records, diagnoses, treatment plans.
- Other Confidential Data: Any information a user expects to be kept private.
If you must log sensitive data, you can do it in a way that doesn’t expose the information directly via masking or hashing. For example, instead of logging sensitive personal information, you can log the hashes of them which can still be used to search for exact values later.
Sending Logs to an Observability Solution
After applying all of the best practices, you’re ready to log. But wait, where do you store the logs? Sure, you can use the same server where the application is running. But this approach has major flaws:
- Log rotation: Logs can pile up quickly leading to increasing disk space usage. To prevent the disk from overflowing, you have to rotate the logs, archive them, and move them to another place so they don't cause the server to run out of disk and crash.
- Single point of failure: Having all your logs in a single place makes it a single point of failure. The server itself might misbehave, leaving you without access. If a server goes down, you won’t have any logs at all to debug what went wrong.
- Security: Customer support employees and other non-technical staff often need access to logs to debug tickets they get from users effectively. However, it can be a security risk to give everyone shell access to the production servers to pull logs.
- User experience: Let’s be honest: it’s not the best thing in the world to scan over tons of text, even well-structured, on a server all by yourself.
That’s exactly where observability solutions shine. An observability solution gives you the tools necessary to be able to easily ship logs to a remote server, store them, and analyze them in a user-friendly way.
Such tools provide a nice UI and UX, granular control over who can see the logs and which one and it is basically an extra log storage. They also enable features such as:
- Monitor with alerts: Alerts are highly customizable notifications. You can configure them to be triggered by some specific errors or by the frequency of errors and myriad other things.
- Graph trends: Since logs are the data points, it is possible to build different data trends and see how the system is performing or how users interact with the application in real-time.
- Health monitoring: It is important to understand how the server itself is doing. How high is the CPU, Memory, or Disk consumption? Are there any spikes in resource usage? Observability tooling provides flexible graphs and tables that can clearly show any resource usage and even more metrics.
HyperDX (opens in a new tab) is an open-source tool that can help collect and store your logs, as well as providing easy search, analytics and alerting on top. Beyond logging, they also support collecting tracing, metrics, exceptions and session replay all in one place. You can try using HyperDX, on either the self-hosted open source version (opens in a new tab) or the cloud hosted version (opens in a new tab).
Choosing logging library
To put all the best practices into action, you need a logging library. Here's an overview of the most popular logging libraries in the Node.js ecosystem.
Console
Good old console. It is a tool available for any developer. It doesn’t require installing libraries and is provided by the environment: browser, Node.js, Deno, etc. It is already familiar to most developers and easy to use.
Console is a global object that is available without the need to import it.
// Logs a plain text
console.log(“Hello world”); // Logs warning with the provided text
console.warn(“Hello world”); // Logs error with the provided text
console.error(“Hello world”);
Notice that even when using different methods, like warn or error, the console still outputs without any log structure.
The console isn’t the best choice by default. It is too generic and wasn’t built
with best logging practices in mind. For example, the console cannot save logs to
a file or send them over to a remote server on its own.
When you call console.log(“Hello world”) the result of the function call is printed directly to the standard
output (stdout). Another painful point is the log format: the most popular and
widely used log format is JSON, but the console only outputs plain text by default
and requires manual additions to print out JSON-formatted logs. It is
possible to write an abstraction over the console and make it work as you like,
but it requires time and effort, and there is no guarantee that it will work
smoothly in the first couple of iterations.
Pino
Pino is a lightweight and fast logging library made with performance in mind.
Key advantages:
- Structured By Default: The Pino logger has all messages structured by default and natively prints objects into JSON.
- Performance (opens in a new tab): When running multiple benchmarks with different logging libraries, Pino almost always wins.
- Size (opens in a new tab): When the library is minified and gzipped (archived), the size is less than 3 KB, just the minified version is a bit more than 7 KB.
- Browser compatible (opens in a new tab): It is relatively easy to set up Pino to work within a browser.
- Bundling support (opens in a new tab): You can use tools like Webpack and ESBuild to bundle the library.
It includes almost everything you might need and is fairly easy to set up. Install the library using your package manager.
Install using NPM
npm install pinoPino comes with structured logging by default. You don't need to configure anything for it.
import pino from “pino”;
const logger = pino();
logger.log(“Hello world”);
The output from the following code is.
{
  "level": 30,
  "time": 1531171074631,
  "msg": "Hello world",
  "pid": 657,
  "hostname": "Davids-MBP-3.fritz.box"
}
Notice that the log entry includes the message itself, log level, timestamp, process ID, and hostname for free. Unlike a plain console, you don't need to write any extra code to get this information.
Winston
Another popular library for logging is Winston (opens in a new tab).
Key advantages:
- Variety of built-in features. The library provides many built-in features, such as different kinds of transports, formats, exception handlers, and more.
- Highly customizable. You can customize many things in Winston. Don't like the default log levels? Give them the names that you like.
To start using Winston, install the package.
Install using NPM
npm install winstonAfter that, import the Winston library into a file and create a logger.
import winston from “winston”;
const logger = winston.createLogger({
  level: “info”,
  format: winston.format.json,
});
logger.log(“Hello world”);
The produced output.
{
  "level":"info",
  "message":"Hello world"
}
Conclusion
The importance of logging in Node.js applications is hard to overestimate.
- It makes debugging easier, improving DX and errors less frequently while improving UX.
- By incorporating logging, you start collecting the data points that you, as a developer, can share with management and show a tangible impact on the business.
- Logs are required by some of the local laws, and complying with them is mandatory.
To ensure you can effectively work with logs, follow the best practices mentioned in the article. They make it easy to work with any kind of logs you might encounter.
On top of that, following best practices opens the doors to seamless integration with monitoring and observability tools such as HyperDX (opens in a new tab) that enhance your logging experience even further by providing real-time visualization, search and alerts.