January 2024 Release Notes

We're kicking off the new year on a strong note - we've got a lot of new features and improvements to share with you. Here's what's new in HyperDX for January 2024:
More Charts, Less Problems
We've made a host of improvements to charts in HyperDX this month.
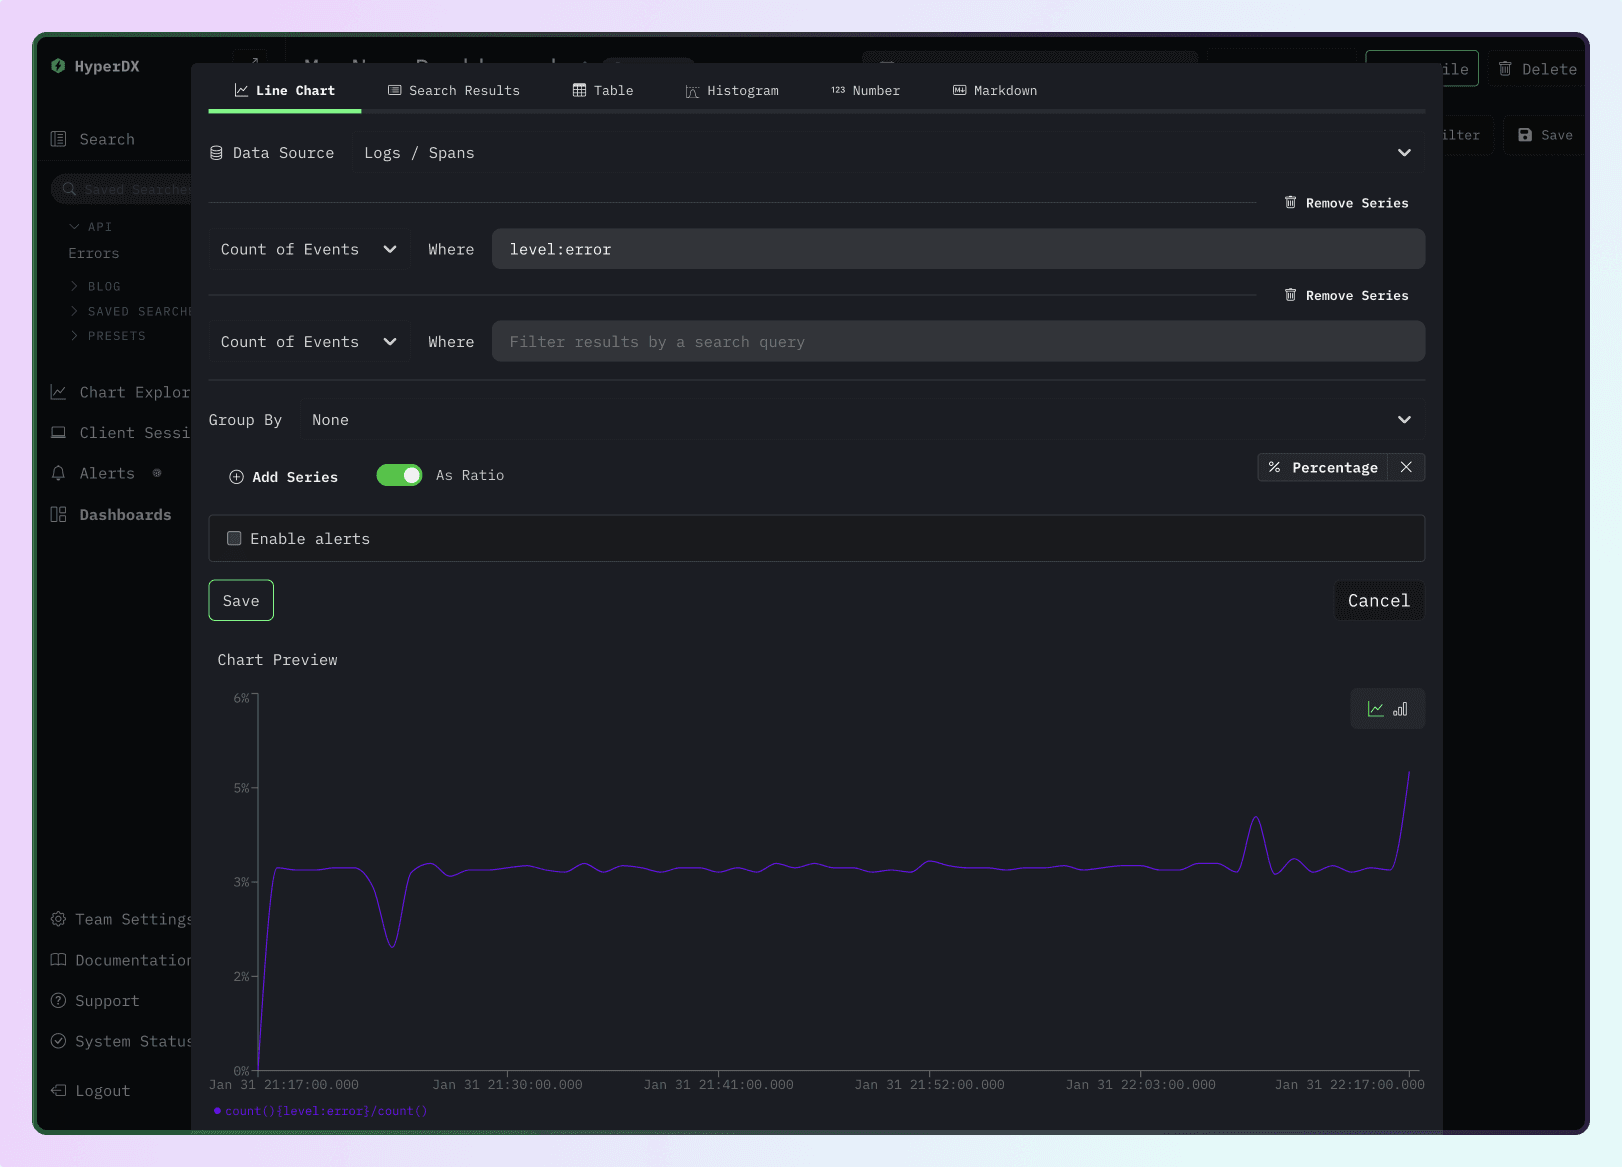
- You can add multiple series/queries to a single chart, as an example you can plot average and max durations on a single chart.
- You can also compute the ratio between two series, as an example you can plot the error rate as a percentage of the total requests.
- We've also added support for OpenTelemetry histograms as a metric type, so you can now calculate percentiles of your histogram data.
- And finally, your code can query chart data programatically via the new charts API.
Oh and don't forget - you can alert on anything you can chart, so all these improvements carry over to how you can monitor your app as well.

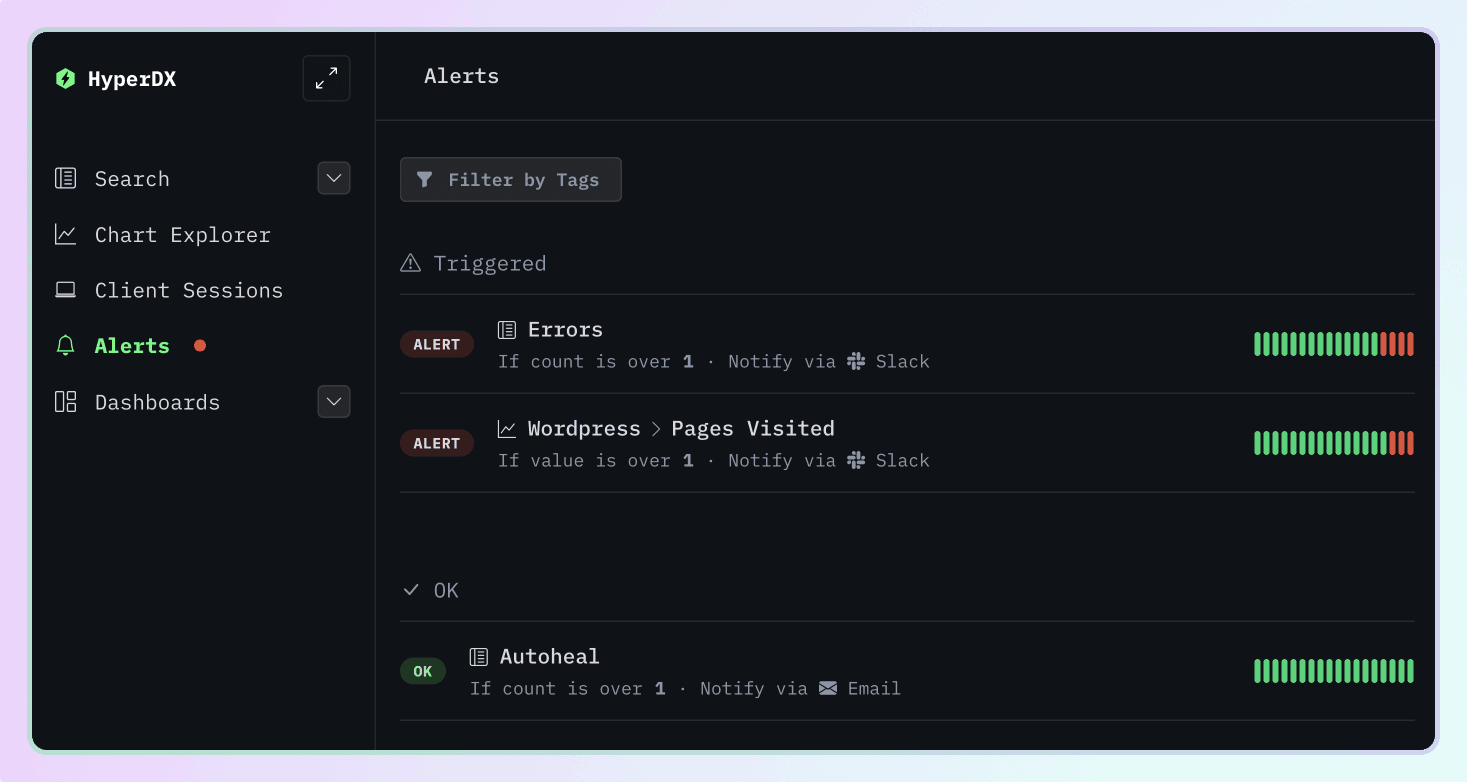
New Alerts Overview Page
Need to see all your alerts in one place? We've got you covered. Check out the new alerts page to see all your alerts, status, history and more at a glance.

Tagging Saved Searches and Dashboards
Saved searches and dashboards overflowing your side bar? Now you can add tags to any saved search or dashboard to organize and find them more easily.

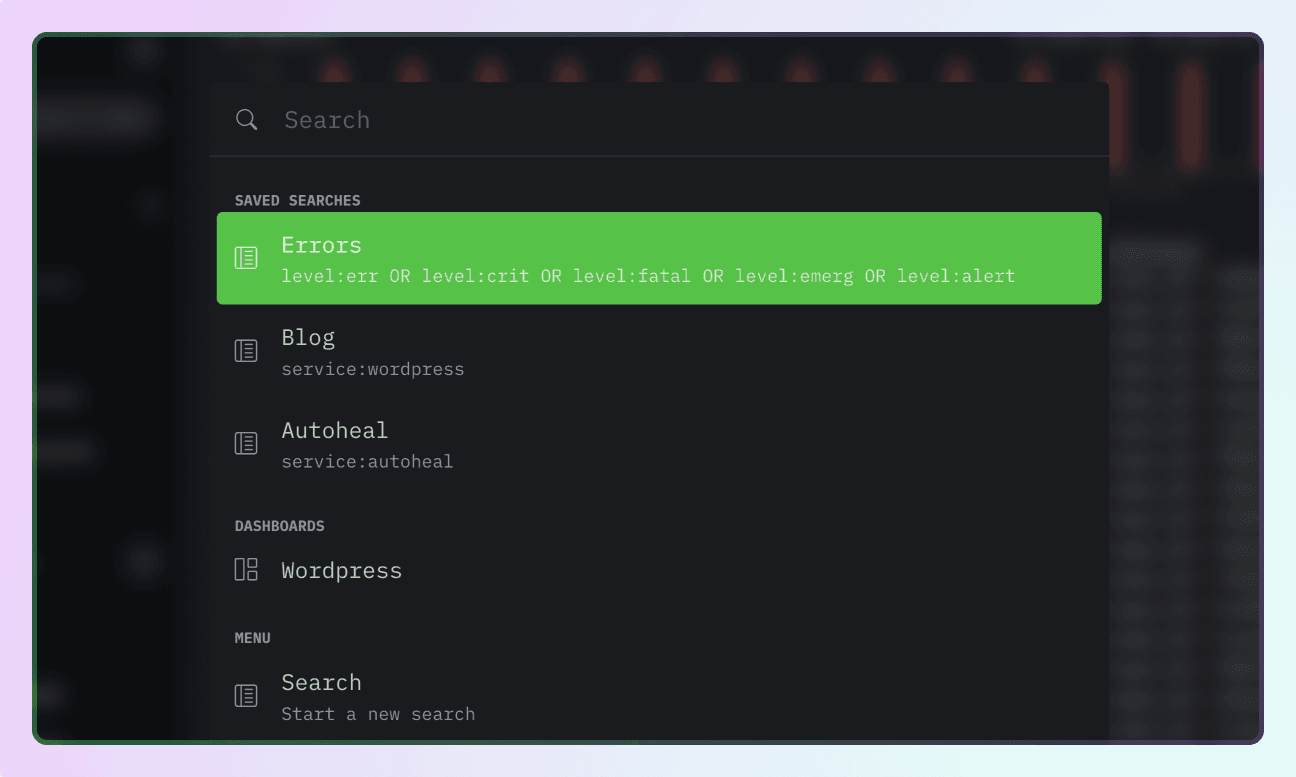
Cmd+K Spotlight
Speaking of finding easily, we've added a new Cmd+K shortcut to open
Spotlight. Use it to quickly find and navigate to any saved search, dashboard,
or menu item without taking your hands off the keyboard.

Getting Started
HyperDX is free and open source. Try out some of these features today by signing up for a free trial or try them out in our sandbox (opens in a new tab). You can also always spin up your own open source instance (opens in a new tab).