Sending and Testing OpenTelemetry Events using cURL

Released in 1996, curl still finds it's way in to nearly every web developers toolbox. When it comes to debugging HTTP issue, nothing breaks the problem down any simpler than curl.
In this article we are going to send some data to the OpenTelemetry using the OpenTelemetry Protocol (OTLP) via HTTP. This will allow us to use a simple tool like curl to send OpenTelemetry data directly from the command line.
We’re going to be using HyperDX (opens in a new tab) in this article, but this will apply to any OpenTelemetry endpoint provider.
Prerequisites
Before we begin, ensure you have the following:
- A working OpenTelemetry HTTP collector endpoint, in this article we'll use HyperDX's hosted endpoint
curlinstalled on your machine- Optional:
jqinstalled on your machine for the more complicated final script
OpenTelemetry Protocol
First off, lets talk about OpenTelemetry’s Protocol for sending log data to the endpoint. At it’s most basic level it’s just a JSON document, and it looks something like like this:
{
  "resourceLogs": [
    {
      "resource": {
        "attributes": [
          {
            "key": "service.name",
            "value": {
              "stringValue": "Example.Service"
            }
          }
        ]
      },
      "scopeLogs": [
        {
          "scope": {
            "name": "my.library",
            "version": "1.0.0",
            "attributes": [
              {
                "key": "my.scope.attribute",
                "value": {
                  "stringValue": "some scope attribute"
                }
              }
            ]
          },
          "logRecords": [
            {
              "timeUnixNano": "1544712660300000000",
              "observedTimeUnixNano": "1544712660300000000",
              "severityNumber": 10,
              "severityText": "Information",
              "traceId": "5B8EFFF798038103D269B633813FC60F",
              "spanId": "EEE19B7EC3C1B174",
              "body": {
                "stringValue": "Live from the CLI"
              },
              "attributes": [
                {
                  "key": "string.attribute",
                  "value": {
                    "stringValue": "some string"
                  }
                },
                {
                  "key": "boolean.attribute",
                  "value": {
                    "boolValue": true
                  }
                }
              ]
            }
          ]
        }
      ]
    }
  ]
}
For the full example, take a look at OpenTelemetry’s Protocol example repo (opens in a new tab).
Not only can you include basic log data, like the log's message and severity, but you can also include custom attributes and even tie it to a parent span.
Step 1: Generate OpenTelemetry Log Spans
In order to make the above JSON work we’re going to need to make a few changes. First off the timestamps will be far in the past when you’re reading this article. Sending these timestamps to most OpenTelemetry endpoints will result in them being ignored because they are so old. Fortunately we can just omit them for the purposes of this exercise, as they’re optional and it should simply default to the current time the endpoint received them.
The next issue is the TraceId and SpanId, these are a little trickier as they need to be unique, and sending the same one multiple times is not a great practice. That being said, if you were to send the following JSON to the HyperDX endpoint (along with your API key), this would still work.
The following one line command is a little long winded, but it should get the job done.
export API_KEY="[API_KEY]" && curl "https://in-otel.hyperdx.io/v1/logs" -X POST -H "Content-Type: application/json" -H "Authorization: $API_KEY" --data '{"resourceLogs":[{"resource":{"attributes":[{"key":"service.name","value":{"stringValue":"curl.service"}}]},"scopeLogs":[{"logRecords":[{"severityNumber":10,"severityText":"Information","traceId":"5B8EFFF798038103D269B633813FC60F","spanId":"EEE19B7EC3C1B174","body":{"stringValue":"Ping"}}]}]}]}'Copy the above command, replace API_KEY with your HyperDX API key and hit enter.
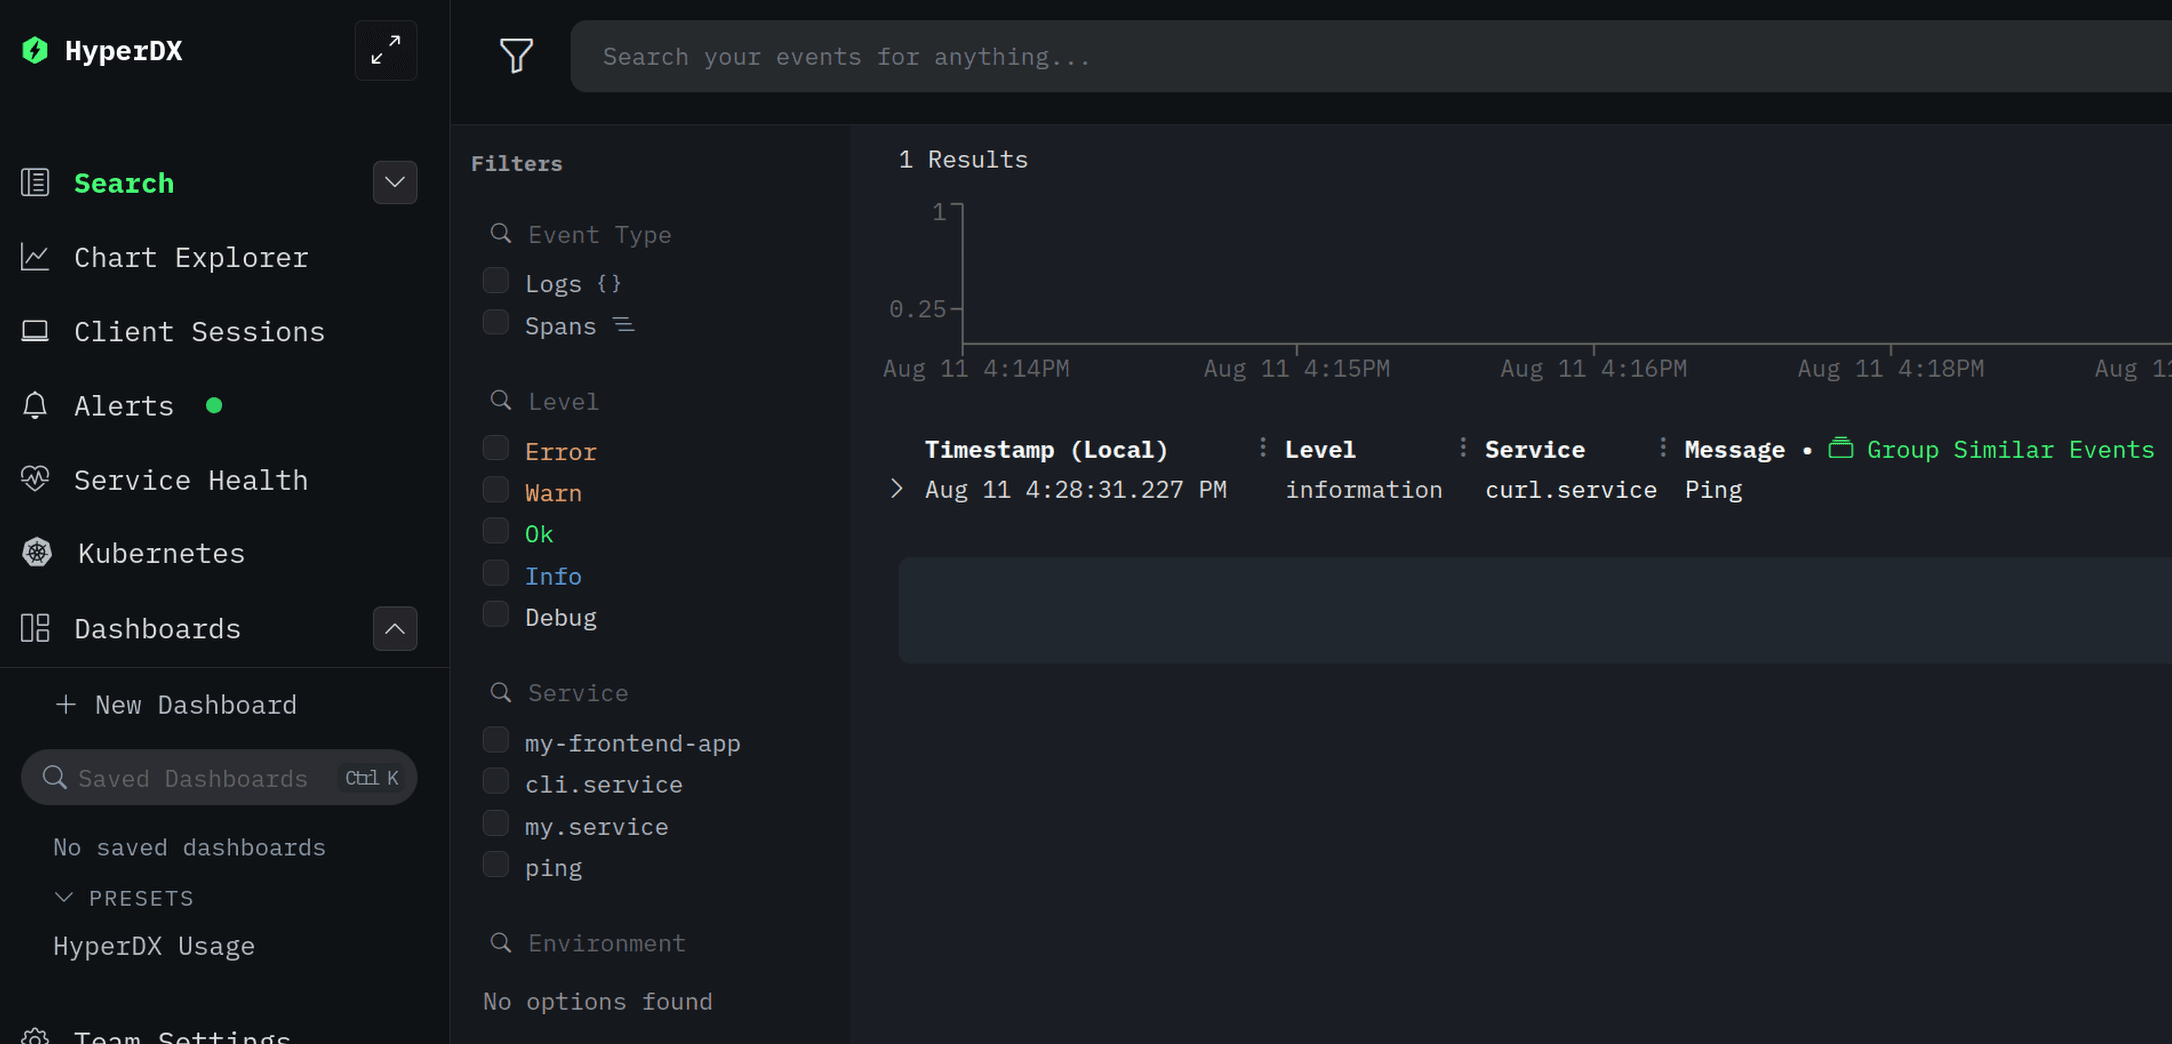
Now, if you take a look at your HyperDX dashboard you should see a “Ping” long from the ‘curl.service’

Let’s break this down:
- We’re setting the
API_KEYto the API key we can find on our HyperDX integration page. - We use
curland setting the proper HTTP method (POST) and headers (Content-Type and Authentication) - We simple pass the JSON as a string directly to
curlwith the —data flag
Let’s BASH our way to something more workable
While this works, ideally we’d like to send some arbitrary data to OpenTelemetry and also fix those span and trace ID’s while we’re at it.
Let’s create the following bash script:
#!/usr/bin/env sh

JSON_TEMPLATE=$(cat <<-_JSON_
{
  "resourceLogs": [
    {
      "resource": {
        "attributes": [
          {
            "key": "service.name",
            "value": {
              "stringValue": "$SERVICE_NAME"
            }
          }
        ]
      },
      "scopeLogs": [
        {
          "logRecords": [
            {
              "severityNumber": 10,
              "severityText": "Information",
              "traceId": "$TRACEID",
              "spanId": "$SPANID",
              "body": {
                "stringValue": "$MESSAGE"
              }
            }
          ]
        }
      ]
    }
  ]
}
_JSON_
)

# Check and see if `jq` is installed
if ! command -v jq &> /dev/null; then
  echo "jq is not installed"
  exit 1
fi

if [ -z "$API_KEY" ]; then
  echo "API_KEY is not set"
  exit 1
fi

# Some variables to substitute into the template
SERVICE_NAME="cli.service"
TRACEID=$(tr -dc A-F0-9 </dev/urandom | head -c 32; echo)
SPANID=$(tr -dc A-F0-9 </dev/urandom | head -c 16; echo)
MESSAGE=$1

JSON=$(jq -c --arg service_name "$SERVICE_NAME" --arg traceid "$TRACEID" --arg spanid "$SPANID" --arg message "$MESSAGE" \
  '.resourceLogs[0].resource.attributes[0].value.stringValue = $service_name |
   .resourceLogs[0].scopeLogs[0].logRecords[0].traceId = $traceid |
   .resourceLogs[0].scopeLogs[0].logRecords[0].spanId = $spanid |
   .resourceLogs[0].scopeLogs[0].logRecords[0].body.stringValue = $message' <<< "$JSON_TEMPLATE")

# Send the JSON data via curl
curl "https://in-otel.hyperdx.io/v1/logs" -X POST -H "Content-Type: application/json" -H "Authorization: $API_KEY" --data "$JSON"
Now we’re able to improve a couple things. First we can pass in an arbitrary message to the script instead of just the hardcoded “Ping”. And secondly, we’re using /dev/random to generate unique and correctly sized traceId and spanId.
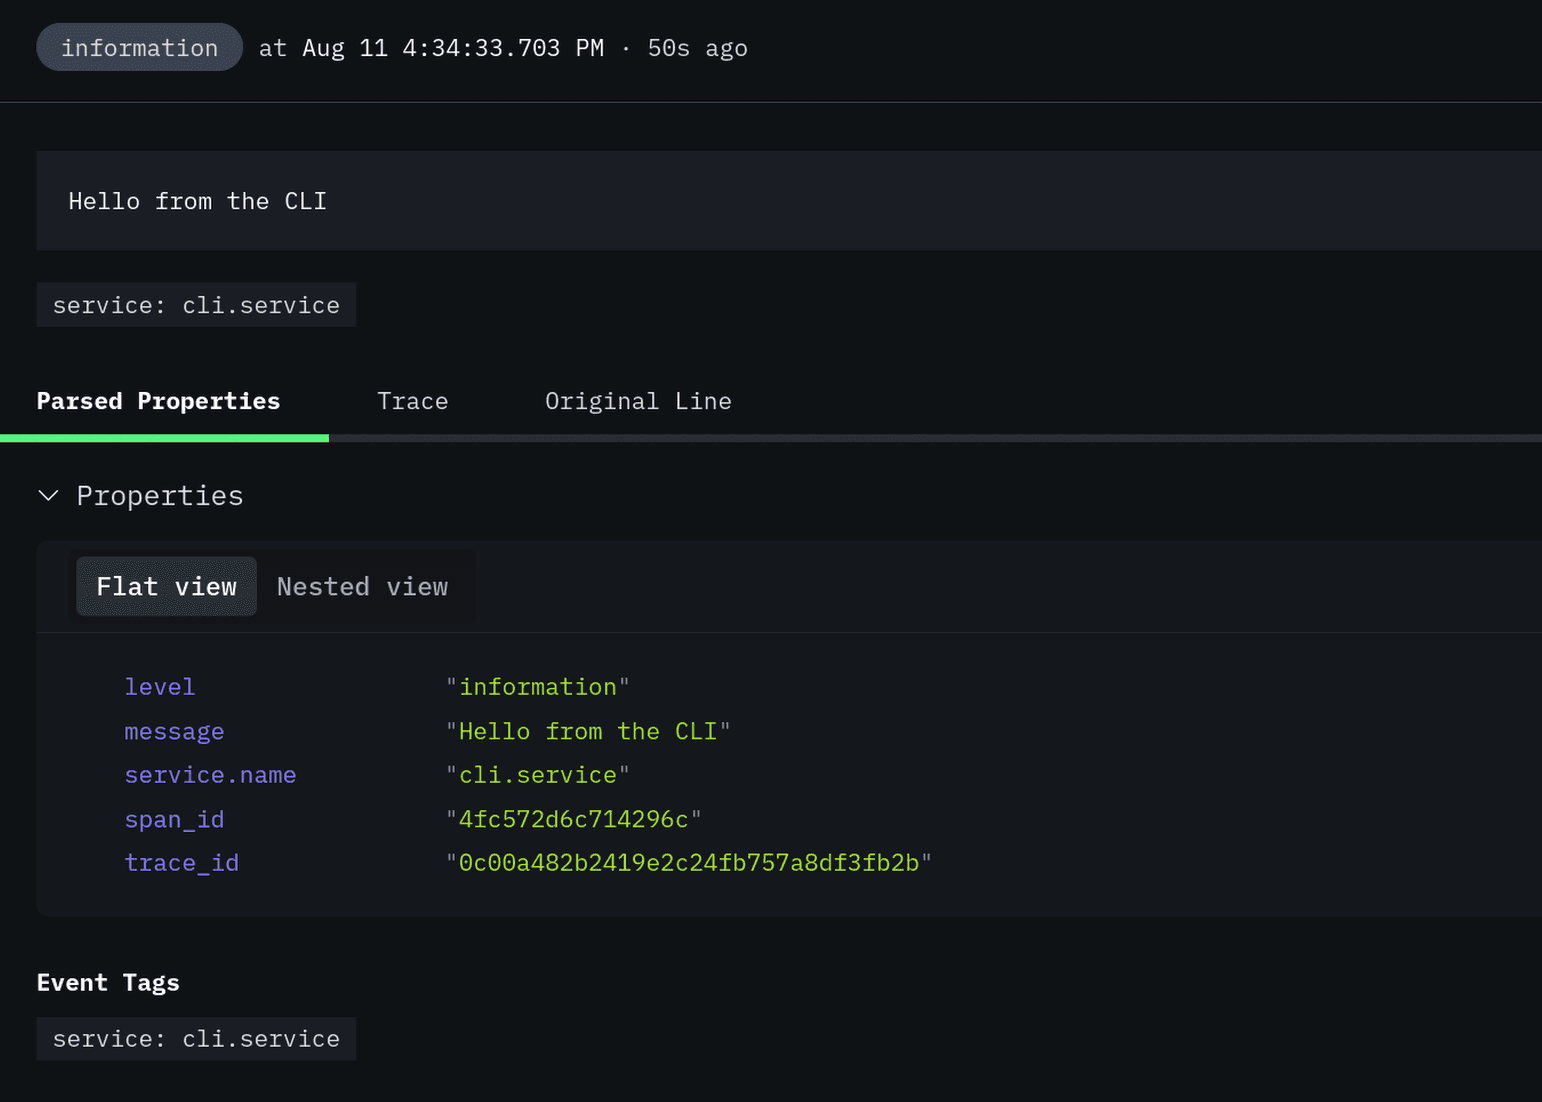
Let’s give it a run with API_KEY=[YOUR_API_KEY] ./log.sh "Hello from the command line"
And you should see something like this:

Where do we go from here?
The point of this article is to showcase how OpenTelemetry sends and receives log data, not to actually suggest that you use curl to send data in production. But if you’re just getting started, it’s a great way to learn more about OpenTelemetry and see it in practice.
If for some reason you do want to get log data out of a machine, take a look at running an OpenTelemetry collector with their FileLogReceiver (opens in a new tab).
If you're interested in storing and analyzing your OpenTelemetry data on an open source and OpenTelemetry-native platform, you can sign up for a free account on HyperDX (opens in a new tab) and start sending your data today.