Why We Chose Clickhouse Over Elasticsearch for Storing Observability Data

Disclaimer: We’re building HyperDX (opens in a new tab), an open-source, dev-friendly observability platform that’s built on OpenTelemetry and Clickhouse. Though we chose Clickhouse because we thought it’s the best option and want to share why, rather than the other way around 🙂
I never thought of myself as a database person, but if you spend enough time thinking about observability, you inevitably start thinking a lot about how to store all this data well (or why it’s stored terribly today). I’ve had plenty of people ask us why we’re building on top of Clickhouse as opposed to the traditional wisdom of Elasticsearch, and I figured it’s worth sharing a blog post on some of the design decisions made by each database and why Clickhouse have made some better tradeoffs for our use case. I won’t be diving into any benchmark(et)ing in this post, but if that’s your jam I’ve linked a few at the bottom of this post.
If you’re short on time, here’s the tl;dr:
- Observability has become more of an analytics problem than a search problem. Elasticsearch just hasn’t been as heavily optimized for analytics as it had been for search.
- Elasticsearch’s inverted index is a liability: it’s too expensive to compute constantly, it frequently outweighs the raw data being stored, and it's probably unnecessary in today’s environment of SSDs.
- Clickhouse’s embrace of sparse indexes and focus on a columnar layout allow it to effectively exploit the blazing fast disks we have available today, rather than spending precious CPU/memory on pre-computing expensive indexes.
Now if you have a bit more time, I wanted to share why the industry started with Elasticsearch, what changed, and why we’ve picked Clickhouse instead.
Elasticsearch

Elasticsearch is pretty amazing at search. It started off as a search engine for finding recipes on cooking sites or searching for items on e-commerce sites, and it really took off as it made it easy for engineers to build fast experiences for users to find needles in haystacks.
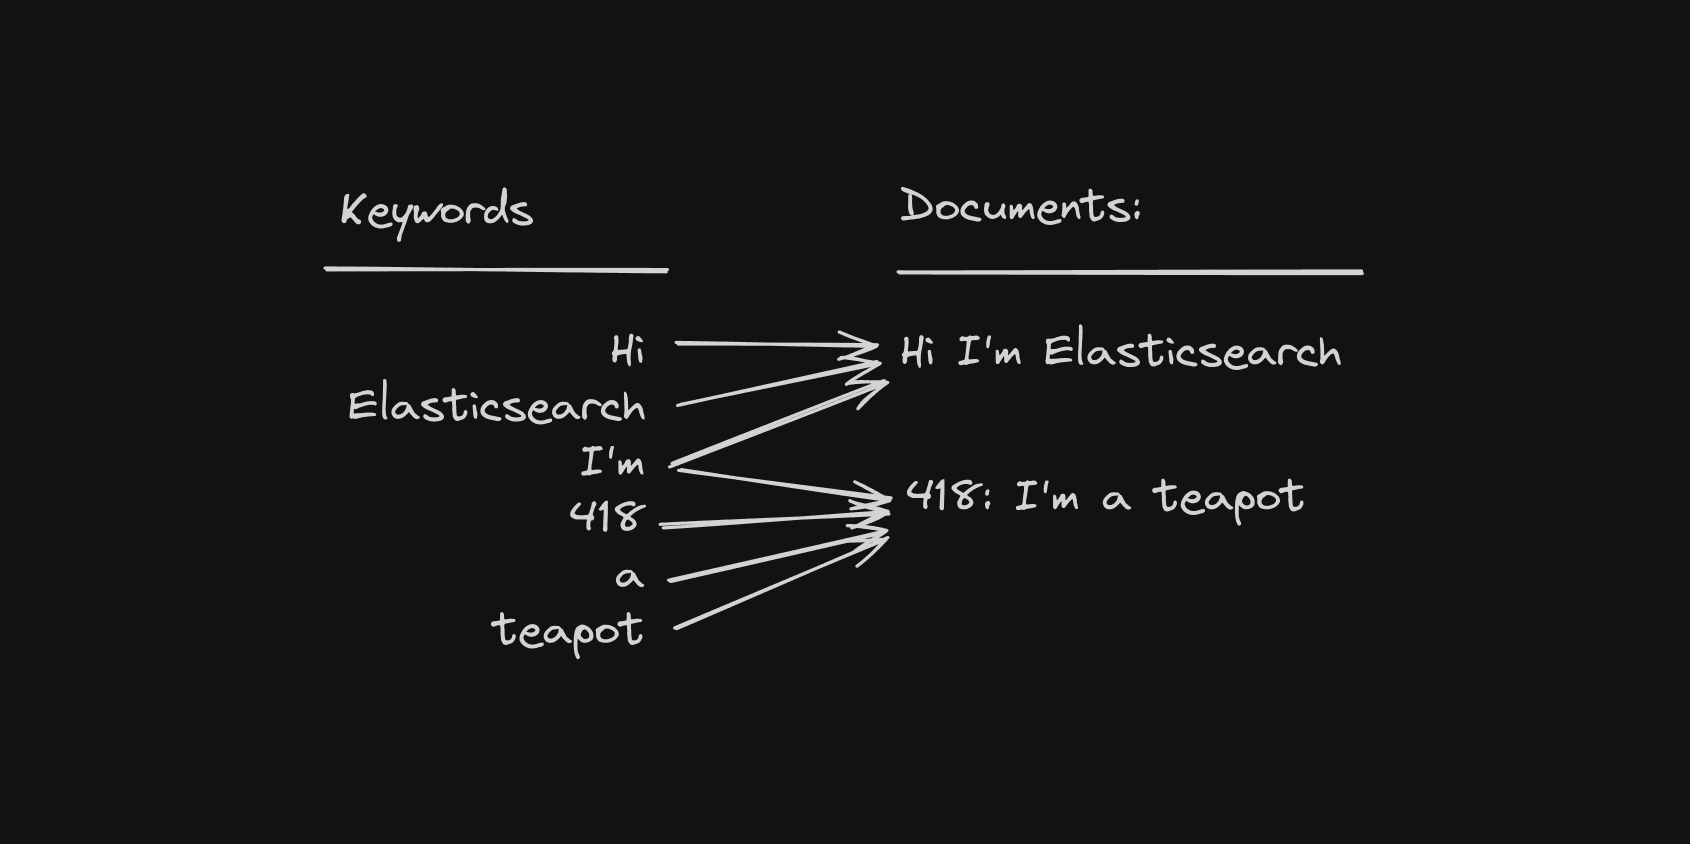
When it comes to finding those needles quickly, Elasticsearch depends on an “inverted index”. An inverted index is a data structure that maps keywords against matching documents ahead of time, so the moment you type in a search, it can simply look up the keyword against the index and pull out the documents the index points to. When you want to add a new document, you simply update the inverted index with all the keywords it can match against, and then it becomes searchable.

This, of course, can be incredibly handy for logs as well. We can simply write our logs into Elasticsearch (via Logstash for example), and later on we can query it with keywords to get matching documents (logs) back quickly.
However, there was a catch. While Elasticsearch was great for datasets that were infrequently updated and frequently searched (how many new recipes are you writing a day anyway?), it becomes inefficient when you have a dataset that is updated extremely often and rarely searched. Applications can easily generate terabytes of telemetry data a day, with engineers only querying it when there’s actually an incident or issue to triage - so the ratio of queries to writes is completely inverted from the traditional search use-case. Just from the fundamental design of Elasticsearch’s indexing, you’ll need to spend a large amount of your computation data simply updating the index.
Not only is it computationally expensive, but these indexes get massive. Compressed indexes frequently outweigh the compressed source data, so not only are you paying for the indexing cost at write time, but you also eat a storage penalty just to keep that index around. Imagine needing 1TB of disk, to store what is effectively 200MB of (compressed) actual data + 800MB of indexes.
Of course, Elasticsearch has continued to be an incredibly popular piece of technology for storing logs because even with the theoretical inefficiency of its index, it still delivers blazing fast and easy search for engineers looking to find keywords in logs. However, that began to change as well.
You Know, for Search Analytics
Nowadays, observability isn’t just about grepping logs for keywords and studying error messages (log management). Increasingly it’s about analyzing log trends and traces across dashboards that scan through billions of points of telemetry, and then slicing and dicing that high level overview to zero in on specific examples to debug. As systems became more distributed and complicated, and as datasets got larger, the problem of observability switched from search to analytics.
Unfortunately, Elasticsearch was built for search, not analytics, and they've had to catch up on analytics use cases. Early on, they introduced a columnar data store to complement their existing document-based structure, though it was largely intended to make Elasticsearch sufficient at analyzing small subsets of data at a time. This made sense - as Elasticsearch typically was supposed to be focused on quickly finding a few needles in a big haystack, rather than laboriously trying to aggregate bunches of hay in a haystack, which is a completely different query pattern (apologies for torturing the analogy!) In the past few years, there has been incremental progress in Elasticsearch to further parallelize queries for aggregations - something an analytics-focused DB would have baked in from the very start.
Even though Elastic created Kibana, a powerful interface for anyone to build dashboards and visualizations on top of Elasticsearch, it’s clear that the use cases of observability were starting to hit against the original design strengths of Elasticsearch.
The Switch to Silicon
While use cases were changing for observability, so was the hardware. Four years after Elasticsearch’s first release in 2014, AWS announced their new SSD-based EBS volumes proclaiming 10x the IOPS compared to spinning hard drives. This meant that databases no longer had to tip-toe around disk operations like they used to – hard drives that were only able to read at MB/s were being upgraded for SSDs that can rip through data at GB/s with costs dropping every year.
This meant that while Elasticsearch had a storage structure that optimized for slower disk read speeds, SSDs were coming around with over an order of magnitude more performance that didn’t require frugal disk access (and heavy memory-based caching Elasticsearch designed around). A new paradigm of searching was starting to become a possibility, one that exploited fast disks rather than expensive pre-computed data structures.
In my view, this was one of the final keys that unlocked the possibility of a new type of database to unseat Elasticsearch as the dominant DB for observability.
Clickhouse: A New Contender
Clickhouse came around with the idea of being able to do fast analytics on streaming, unaggregated data by building a columnar database. While they started off building for traditional web traffic/business analytics use cases, it turns out the same properties required for analytics were applicable for observability as well.
There are two key properties of Clickhouse that makes it perfect for observability, and they both exploit the fast disk speeds available in today’s SSDs: columnar data layout and sparse indexes.
Columns, Columns, Columns
We’ve already talked about how the world shifted from viewing observability as
a
problem of search to one of analytics. It turns out, optimizing for columnar
storage is
a pretty good idea for analytics.

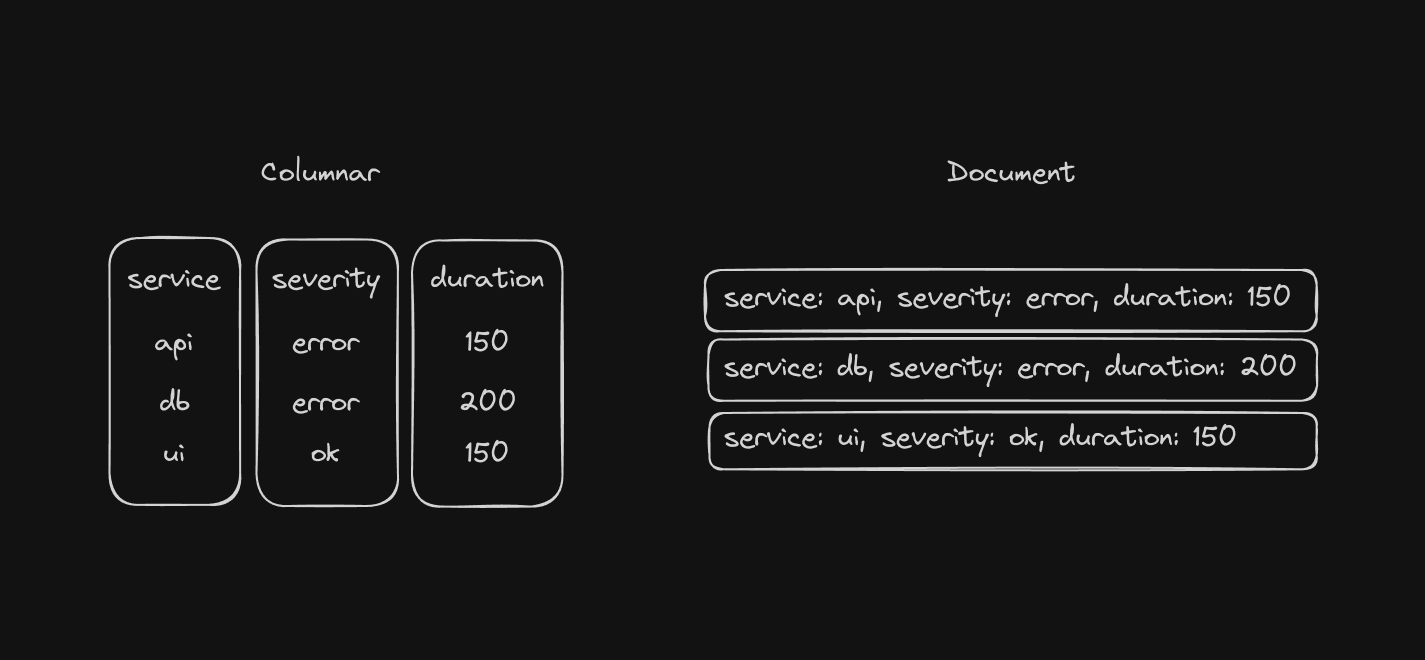
Quick crash course on columnar DBs: Imagine a database that stores some information about the duration, severity, and service name of some API calls. In a traditional non-columnar database (whether it’s row or document based), it’ll be fast to fetch a single row's worth of data at once because the data is stored next to each other. However, if you want to grab all the durations across all rows, it’ll be slow as it has to hop from row to row, introducing disk IO and CPU overhead that you don’t want. In a columnar database, all the values of a specific column are located together, so grabbing the durations across all rows can be done by sequentially reading off the disk, which maximizes hardware performance.
Intuitively, a columnar database is betting that you’re only going to need to access a subset of columns for any analytics query, and that most of the data it’s going to scan in a column will need to be used to calculate whatever analysis the user asked for. With Clickhouse being a columnar DB focused heavily on analytics, it’s spent a lot of time optimizing for this use-case, and the performance shows.
However, this comes with a tradeoff – pulling out individual rows from a columnar database is much slower. While individual column reads are fast, to pull out data for a full row, you need to kick off columnar searches for every column in the table. If your use case was to find individual rows within a DB (a needle in a haystack), this would be a horrible tradeoff and Elasticsearch (or even Postgres) would be a much better choice. However, in observability, it’s relatively rare that you need to retrieve every bit of information about a single log line. More often, you’re looking to analyze billions of data points for a given column (property) at a time. In the worst case, instead of waiting 5ms for Elasticsearch to return a single document, Clickhouse might need to take 100ms to get you a single row. To the user though, this is a barely perceptible difference. However, a graph that might take a few minutes to load in Elasticsearch may only take seconds in Clickhouse. For most users, this is a great tradeoff.
Sparse Index - The Secret Sauce
While columnar layouts are quite an obvious optimization to make, the sparse index is the real secret sauce. Unlike an inverted index, which creates a dense mapping from every term to each specific row or document in the database, ClickHouse uses a sparse index. In this approach, every couple thousand rows (a granule) have a single index entry, summarizing the range of data contained within the block of rows. They even have probabilistic data structures like bloom filters that allow you to efficiently describe whether a specific term or ID exists within the block of rows or not. You can think of sparse index as the 80/20 of indexing - it still optimizes away a lot of the work needed at query time, but at a much lower cost to create and store.
Quick crash course on bloom filters: you can think of them as a Set data structure, but instead of it being able to answer if the Set.has(value) is true/false, it can answer if the BloomFilter.has(value) is maybe or false. They’ll return false positives, but never false negatives. The tradeoff is that they can be several orders of magnitude smaller in size than the set of data they remember.
What this looks like in practice is if you’re looking for a specific ID—such as get me all the logs from “pod_id: a…” that happened yesterday—you can design the schema in such a way that Clickhouse will first look at the sparse index to find all the granules (groups of thousands of rows) that overlap with that timeframe. Afterwards, it’ll look at each granule’s bloom filter index, and see if the pod_id you specified might be within the granule. Once it determines which granules might have the pod_id you want, it’ll linearly scan the thousands of rows and do a direct comparison against the raw data to see if any rows actually match, and if so, return any matches.
The linear scan may sound inefficient, as most rows in a granule won’t match your search, and even many (if not most) granules may not have any matches at all. However, disk read inefficiency is affordable (or even optimal) due to the speed and low cost of SSDs, compared to the computation resources needed to create and store smarter data structures that are more surgical (ex. Elastic’s inverted index). Fundamentally, we’re saying that it’s okay for us to afford high-bandwidth SSDs and use some extra compute at search time, to avoid needing to create and store dense inverted indexes at insertion time. When your workload is write-heavy, read-light, this is a tradeoff you’ll take any day of the week.
It’s Not All Green On the other side
As amazing as Clickhouse is, it’s not exactly a perfect solution. There are areas that make it challenging for a team to just start building an observability tool with it as-is. For one, the performance benefits of Clickhouse don’t quite come for free. Instead, it requires experimentation with the schema and indexing, and understanding your query workloads to get it right. Clickhouse gives you a ton of tools to build a fast DB cluster, but it’s very much on the end-user to hold it the right way to get what you need out of it.
It’s also more complex to query out of the box. SQL is extremely expressive, but can be awkward to use, especially when utilizing performance tricks like materialized columns. Uber has talked a bit about how they’ve solved this issue internally by building tooling around this (opens in a new tab).
However, Clickhouse has a ton of the basics of what you want for the next-generation of an observability database—which is why we’ve built HyperDX on top of Clickhouse, and we’re able and willing to invest in the resources to bridge the gap between the raw tools that Clickhouse exposes for good performance and what UX developers want on top to solve their 2am incidents.
Final Notes/Caveats - this article already got a bit too lengthy, but a few notes/caveats that I wanted to briefly tack on:
- I’ve said observability shifted from search to analytics, but in reality it’s a bit more complicated than that. I think a wordier way to say it is that we shifted from searching unstructured logs (Splunk-style) to structured observability data (structured logs, metrics, traces). This unlocked a whole new set of questions that we can answer (where observability is today). There’s too many terms in this industry and it didn’t seem useful to try to be too specific on it here.
- I’ve skipped covering time series databases (and metrics) completely, as this article would get way too long and nuanced, perhaps something I’ll get a chance to write about later. Hint: High cardinality should be your friend, not your enemy and traditional TSDBs may not be so happy about that.
- There’s a few other Clickhouse things I skipped over, primarily the way primary keys/part merging works in Clickhouse which ties into the performance of the columnar search. Clickhouse also has better search directly on S3 support. Another tradeoff in Clickhouse is the need to batch inserts to maximize performance, whereas Elasticsearch has the batching built-in (Clickhouse has async insert, but they are not as durable as Elasticsearch’s internal batching).
- Often Elasticsearch has been described as purely a document database (I’ve made that mistake myself!) However it does have columnar layout as well - I suspect in the end, it’s hard to build a database that does both, and observability query patterns today favor DBs that are great at analytics and okay at search, rather than the other way around. I’d love to see the Elastic or OpenSearch team prove me wrong!
- There’s lots of great benchmarketing online comparing database performance, here’s a few interesting ones: